FIGURE 7.

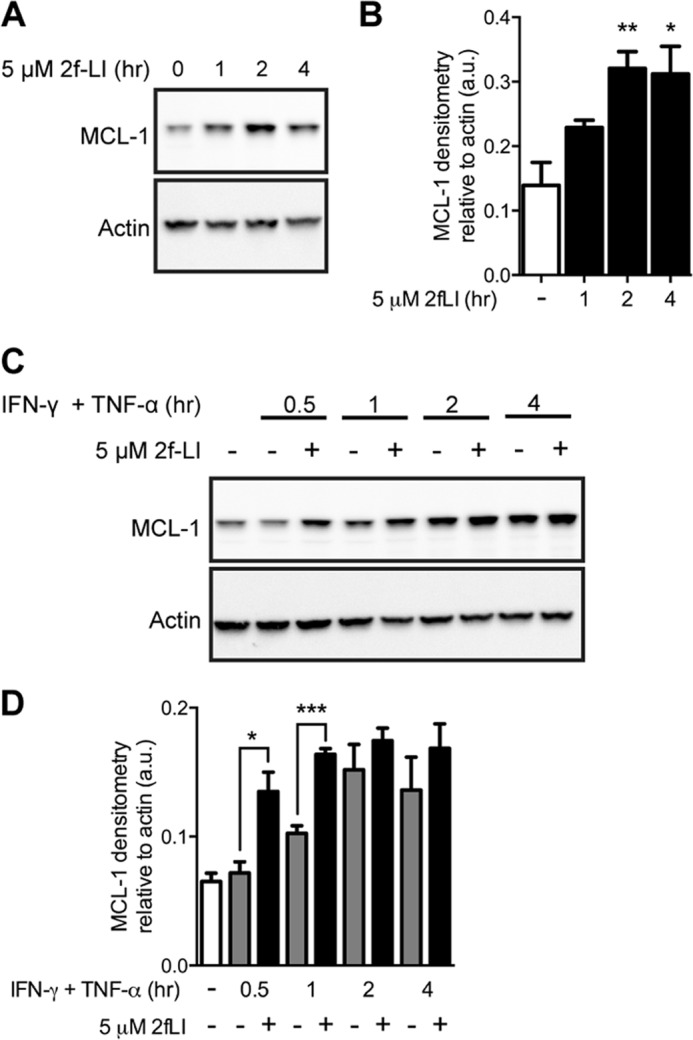
Activation of PAR2 increases MCL-1 expression. A, serum-starved HT-29 cells were stimulated with 2f-LI and harvested at the indicated times. MCL-1 protein expression was analyzed by blotting whole cell lysates. Representative blot of n = 3 is shown. B, MCL-1 protein densitometry relative to actin. Statistical analysis was done by one-way ANOVA followed by Bonferroni's multiple comparisons test (n = 3). *, p < 0.05; **, p < 0.01 compared with untreated cells. C, serum-starved HT-29 cells were pretreated with 2f-LI for 1 h followed by incubation with IFN-γ and TNF-α for the indicated time. Whole cell lysates were blotted for MCL-1. Representative blot of n = 4 is shown. D, densitometry of MCL-1 protein relative to actin. Statistical analysis was done by unpaired t test (n = 4). *, p < 0.05; ***, p < 0.001. a.u., arbitrary units.
