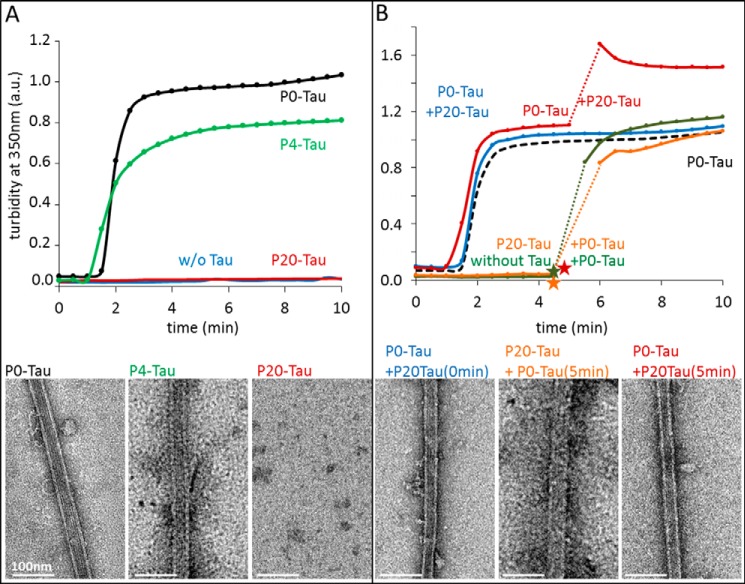
FIGURE 6.
Effect of Tau phosphorylation on Tau-induced microtubule assembly. Light scattering at 350 nm was recorded over time to follow the microtubule assembly in the presence of Tau in different states of phosphorylation. Tubulin concentration was 25 μm; Tau concentrations were 5–10 μm, and assembly experiments were performed in the presence of 1 mm GTP at 37 °C. Directly after the turbidity experiments, the solutions were stabilized with 2% glycerol and immediately prepared for negative stain EM (kept at 37 °C during the procedure); representative images are shown below the curves. A, unphosphorylated P0-Tau (black curve, bottom left image) induces pronounced assembly of microtubules (from phosphocellulose-purified tubulin) with a plateau value normalized to 1. The phosphorylated P20-Tau (red, bottom right image) cannot promote tubulin assembly. Tubulin alone (blue) does not assemble in these conditions either. Dephosphorylation to P4-Tau (with alkaline phosphatase) largely rescues its MT assembly competence (green, bottom middle image) at 5 μm concentration. B, 5 μm unphosphorylated P0-Tau retains its ability to promote MT assembly in the presence of equal concentrations of 5 μm hyperphosphorylated P20-Tau (blue, bottom left image), indicating that P20-Tau is neutral with regard to MT assembly. P20-Tau does not sequester P0-Tau from assembled microtubules when added to initially P0-Tau-assembled MT (red curve, bottom right image) after 5min (time point shown by red star). Tubulin does not assemble with P20-Tau (orange, bottom middle image), but it regains assembly competence when P0-Tau is added after 5 min (orange star), showing that unphosphorylated Tau overrules the inert hyperphosphorylated Tau. Tubulin incubated alone (green curve), before adding P0-Tau (green star) after 5 min, shows a similar assembly (control). Curves are normalized to 1 arbitrary unit (A.U.) of P0-Tau and tubulin at 5 min (plateau phase), which is presented as a control as black dashed curve.

