FIGURE 7.
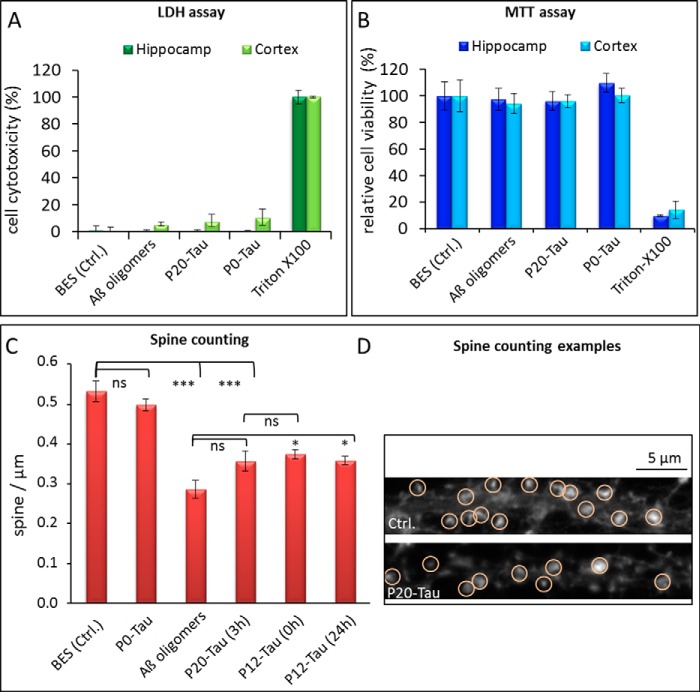
Influence of P-Tau oligomers on the cell metabolism and dendritic spine densities in primary neuronal cells. Cytotoxicity in primary neuronal cell culture from mouse cortex and hippocampus was tested after a 3-h incubation with 1 μm P0-Tau, P20-Tau, and Aβ-oligomers for comparison. A, LDH assay; B, MTT assays were performed from the same cultures, taking supernatant (for LDH) prior to performing the MTT assay with the remaining cells. 2% Triton X-100 was used as a toxic control (100%) and 2% buffer (50 μm BES) as a negative control. The relative cell cytotoxicity was calculated (according to the assay protocol) from the LDH release of cells after cell lysis with 2% Triton X-100 (maximal LDH release) and 2% buffer-treated cells (minimal LDH release in viable cells). Cell viability was determined by MTT assay, where the value of buffer treated cells was set to 100%. Error bars indicate the S.D. from n = 3 independent experiments. C and D, quantification of actin-enriched protrusions (spine) density on dendrites. Counting of actin-enriched protrusions (defined as dendritic spines by phalloidin stained F-actin) in primary neuronal hippocampal cultures was carried out in immunofluorescently stained cells using phalloidin as F-actin stain to visualize the protrusions (D). At 30 μm distance from the cell soma, a length of 20–30 μm was chosen, and the phalloidin-positive spines were counted. Primary neuronal cells were treated for 3 h with BES buffer, 1 μm Aβ oligomers (aggregated for 1 h at 37 °C (32)), and 1 μm P20-Tau (aggregated for 3 h at 37 °C). Before adding P20-Tau to the cells, part of the sample was analyzed by TCSPC (see Fig. 4). After incubating 50 μm highly phosphorylated P20-Tau for 3 h at 37 °C in BES buffer, it contained about 25% oligomers and 75% monomers. Incubating the cells for 3 h with P12-Tau, either preincubated for 0 h or 24 h at 37 °C in BES, caused also a significant spine reduction. Approximately 20 different cells were analyzed for each condition; an example of an immunofluorescence image is shown next to the diagram with examples of counted spines in red circle. Error bars represent STEM (n = 20 cells); analysis of variance test between the groups revealed ns = not significantly different, p < 0.05 (*), and highly significant for p < 0.001 (***) for the indicated columns.

