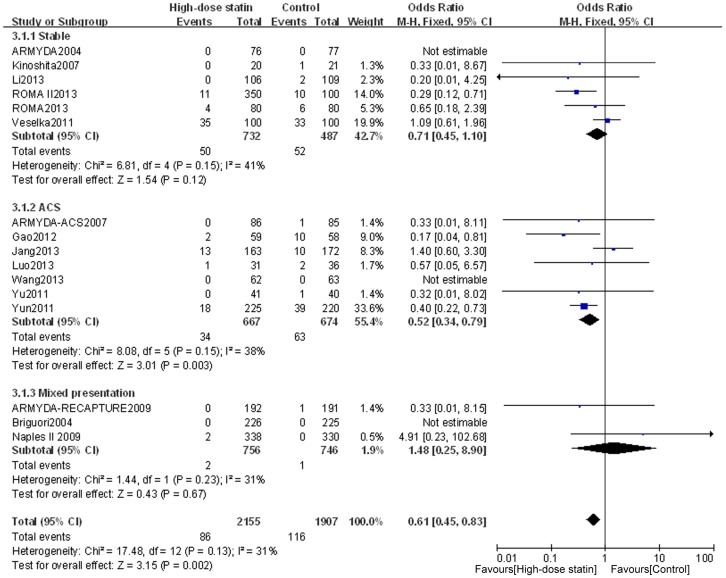
Figure 4. Forest plots for MACE incidence for patients stratified by different clinical presentation.
Forest plots were generated using Review Manager 5.2.0 for patients with stable angina, ACS or mixed disease presentation from individual and pooled trials. The incidence of MACE was expressed as a dichotomous variable, and the results were expressed as odds ratios (OR) with 95% confidence intervals (CI). Heterogeneity across trials was evaluated with I2 statistic, defined as I2>50%. Because the heterogeneity was low, a fixed-effect model was used.

