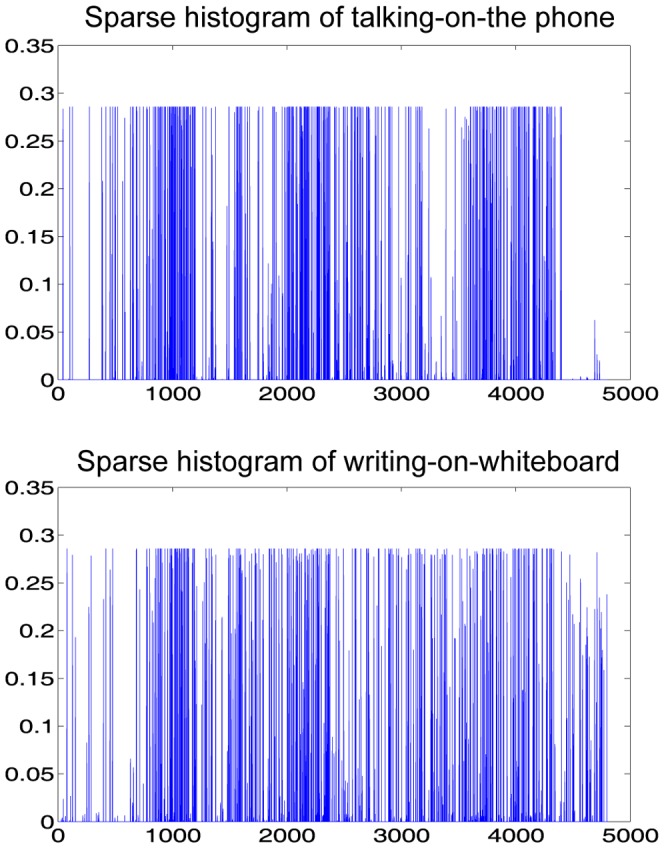
Figure 5. Sparse histograms of “talking on the phone” and “writing on the white board” in the CAD-60 dataset.

The sparsity degrees are  and
and  respectively. Note that the sum of the histograms is
  .
.

The sparsity degrees are  and
and  respectively. Note that the sum of the histograms is
  .
.