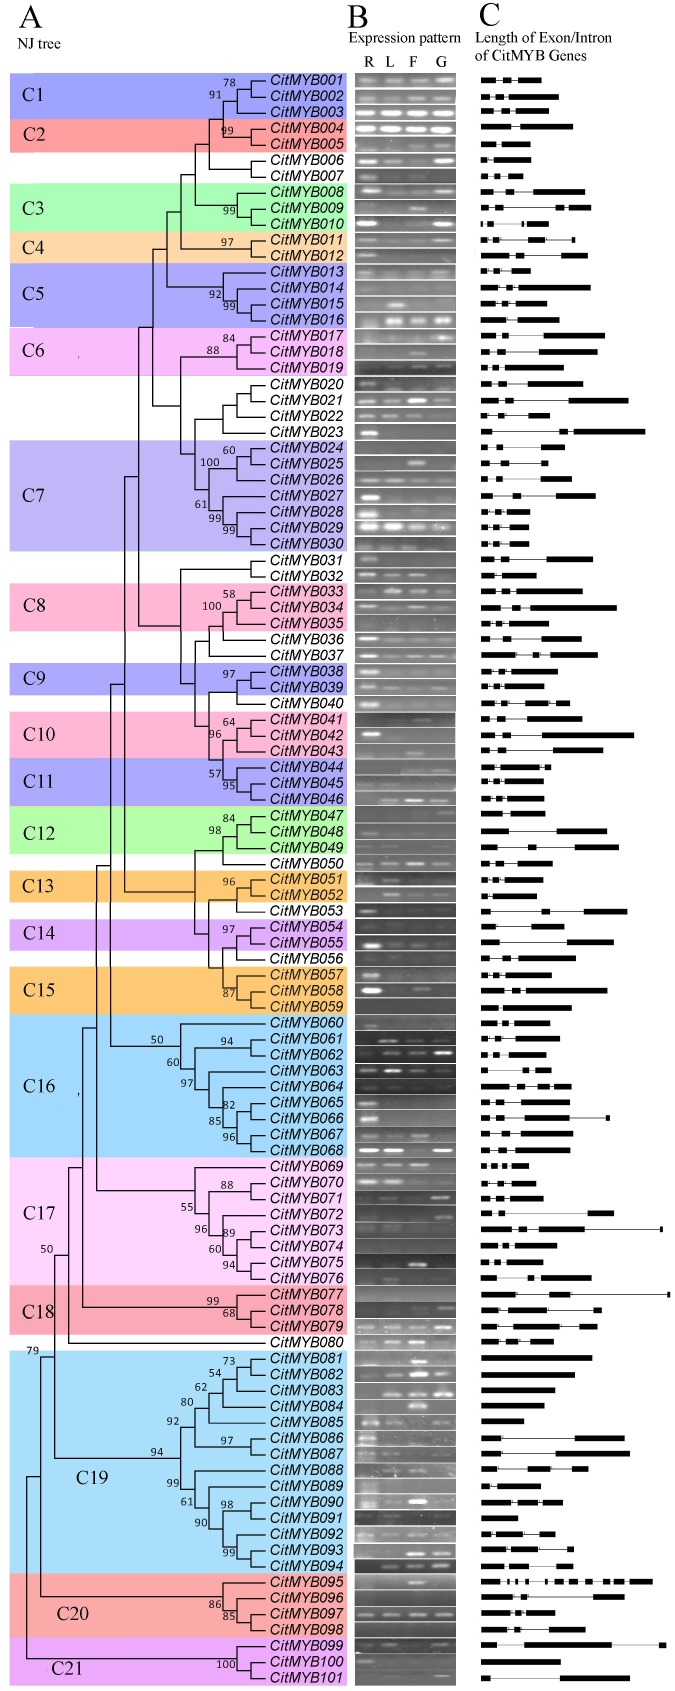
Figure 3. Phylogenetic relationships, intron pattern, expression pattern, and subgroup designations in R2R3MYB proteins from citrus.
A, The neighbor-joining (NJ) tree based on the complete protein sequences of 101 CitMYBs and the bootstrap values less than 50 are not shown in NJ tree. The tree shows the 21 phylogenetic subgroups (C1–C21) marked with colored backgrounds. Twelve proteins did not fit well into clusters. B, The gene structure is presented by exon (black boxes) and intron (black line between the black boxes). The number indicated the phases of corresponding introns. C, The expression patterns of 101 CitMYB genes in different organs. The letter R above the column of expression data refers to root, L refers to leaf, F refers to flower and G refers to fruitlet.

