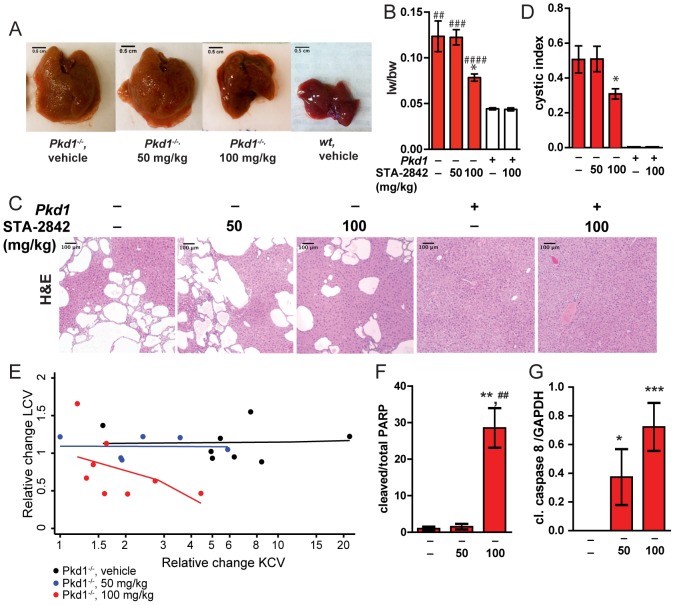
Figure 3. Histopathological development of cysts.
(A) Representative livers collected from Pkd1 –/– or wt mice treated with vehicle or STA-2842 at the indicated doses, at 6.5 months of age. (B) Liver weights (lw) to body weight (bw) ratio of in wt (+) or Pkd1 –/– (–) mice after 10 weeks of treatment with STA-2842 (50, 100) or vehicle (–). n = 5–8 mice. * indicates comparisons to Pkd1 –/–, vehicle-treated mice; # indicates comparisons to wt vehicle-treated mice: *, P<0.05; ##, P<0.01; ###, P<0.001; ####, P<0.0001. (C) Representative H&E stained liver sections after 10 weeks of treatment with vehicle or drug in wt (+) or Pkd1 –/– (–) mice, indicating extent of cystogenesis. Scale bars = 100 µm; magnification = 10x. (D) Cystic indices quantified as a percentage of grid intersections that cross cysts on H&E slides. n = 6–8 mice. * indicates comparisons to Pkd1–/–, vehicle-treated mice: *, P<0.05. All data graphed as mean ± standard error of the mean (SEM). (E) Relative change in cyst burden by drug dose (6 month value divided by 4 month value), with simple linear fits of the relationship shown. None of the slopes were statistically significant (p>0.11 in all three cases). Since the range of values differed among the three doses, the X-axis is drawn on the log scale to better depict the relationships. F. Relative expression of cleaved PARP, normalized to total PARP, following treatment of Pkd1 –/– (–) mice with the indicated doses of STA-2842. **, P<0.01 to vehicle-treated mice; ##, P<0.01 relative to mice treated with 50 mg/kg STA-2842. G. Relative expression of cleaved caspase 8, normalized to GAPDH, following treatment of Pkd1 –/– (–) mice with the indicated doses of STA-2842. *, P<0.05, ***, P<0.001 in reference to vehicle-treated mice.

