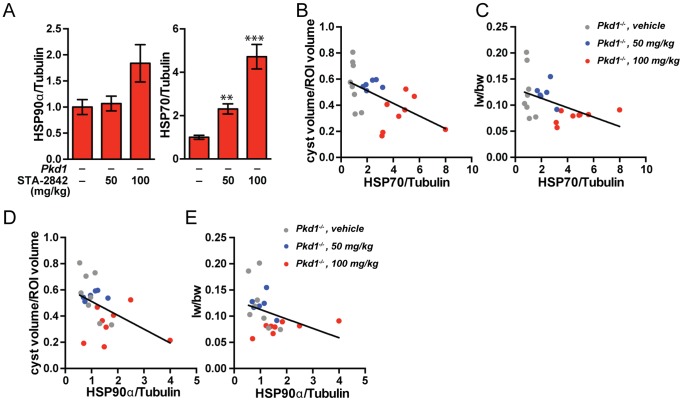
Figure 4. Changes in protein expression and activation of heat shock proteins associated with HSP90 inhibition.
(A) Quantification of HSP90α and HSP70 expression levels among the Pkd1 –/– groups. n = 6–8 mice. * indicates comparisons to Pkd1 –/–, vehicle-treated mice: **, P≤0.01; ***, P≤0.001. (B–E) Negative correlations between HSP70, HSP90α expression in the drug treatment groups and (B, D) cyst volume/region of interest (ROI) (P = 0.0046 for HSP70 and P = 0.0136 for HSP90) and (C, E) liver weight/body weight (lw/bw) ratios (P = 0.0141 for HSP70 P = 0.0138 for HSP90). Dots represent individual mice; lines represent linear regression functions. n = 6–8 mice.

