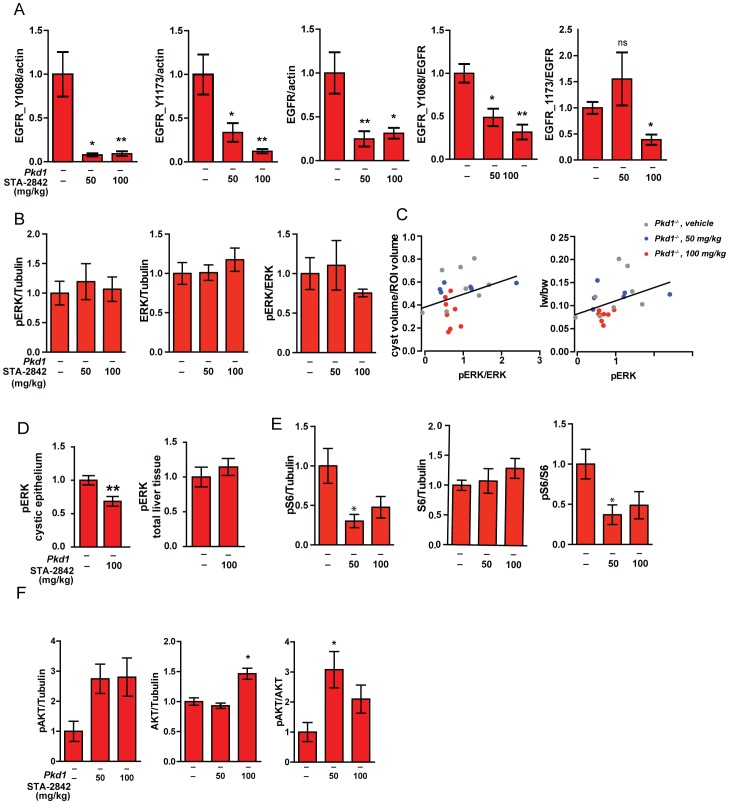
Figure 5. Changes in protein expression and activation of signaling proteins associated with HSP90 inhibition.
(A) Differences in expression of phosphorylated Y1068 and Y1173 EGFR and total EGFR normalized to actin, and Y1068 and Y1173 EGFR normalized to total EGFR, following treatment with the indicated doses of STA-2842. *, P<0.05; **, P<0.01. (B) Insignificant differences in expression of phosphorylated T202/Y204 ERK1/2 or total ERK1/2, normalized to tubulin, and phosphorylated T202/Y204 ERK1/2 normalized to total ERK1/2, following treatment with the indicated doses of STA-2842; differences are not significant (C) Positive correlations between the ratio of phosphorylated T202/Y204 ERK1/2 normalized to total ERK1/2 expression in the drug treatment groups and (left) cyst volume/region of interest (ROI) (P = 0.174) and (right) liver weight/body weight (lw/bw) ratio (P = 0.040). Dots represent individual mice; lines represent linear regression functions. n = 6–8 mice. All data graphed as mean ± standard error of the mean (SEM). (D) Expression of phosphorylated T202/Y204 ERK1/2 in cystic epithelia (left) or total liver (right) quantified from immunohistochemical staining of liver sections from Pkd1 –/– mice treated with vehicle or 100 mg/kg STA-2842 (see Fig S4). **, P<0.01. (E) Differences in expression of phosphorylated phS235/S236 S6 or total S6, normalized to tubulin, and phosphorylated phS235/S236 S6 normalized to total S6, following treatment with the indicated doses of STA-2842; *, P<0.05. P-values for comparisons between Pkd1 –/– vehicle- versus 100 mg/kg-treated groups bordering on significant (P = 0.060). (F) Differences in expression of phosphorylated phS473 AKT or total AKT, normalized to tubulin, and phosphorylated phS473 AKT normalized to total AKT, following treatment with the indicated doses of STA-2842; *, P<0.05.

