
Figure 2. Distribution of baseline intraocular pressure (IOP) and 5-year incidence of primary open-angle glaucoma (POAG) suspect or definite POAG as related to IOP.
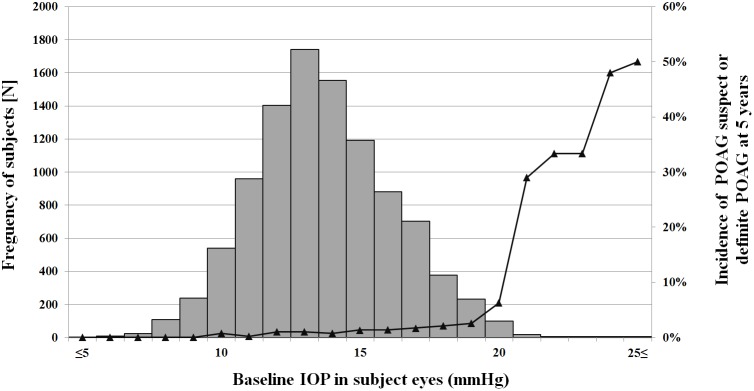
The bar and broken-line graphs respectively show the distribution of IOP and the 5-year incidence of POAG suspect or definite POAG.