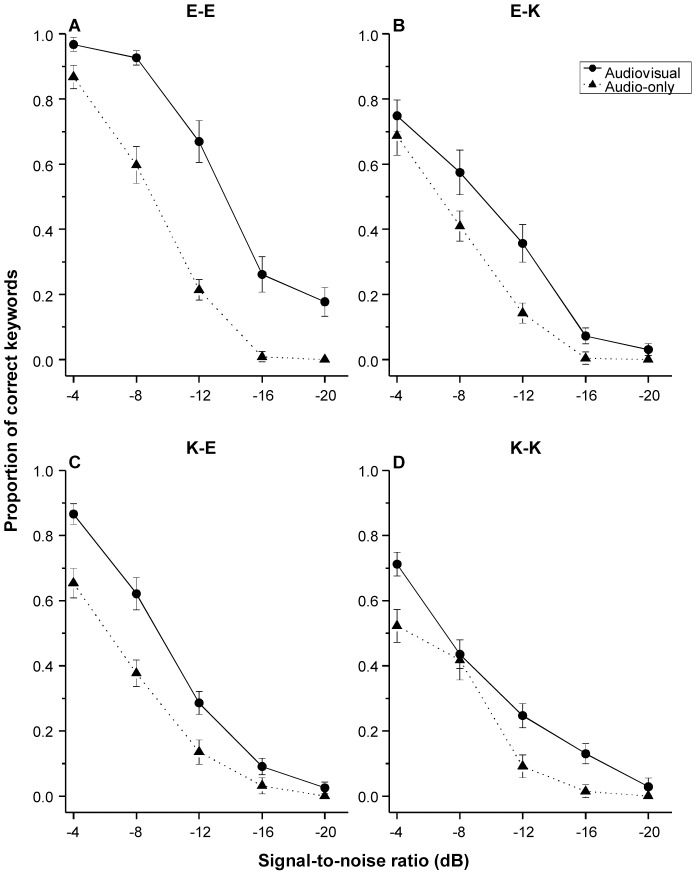
Figure 3. Mean proportion of correctly identified keywords as a function of signal-to-noise ratio in audio-only and audiovisual conditions across the four speaker-listener groups (see Figure 1 for detailed descriptions of the four speaker-listener groups).
Error bars represent standard error.

