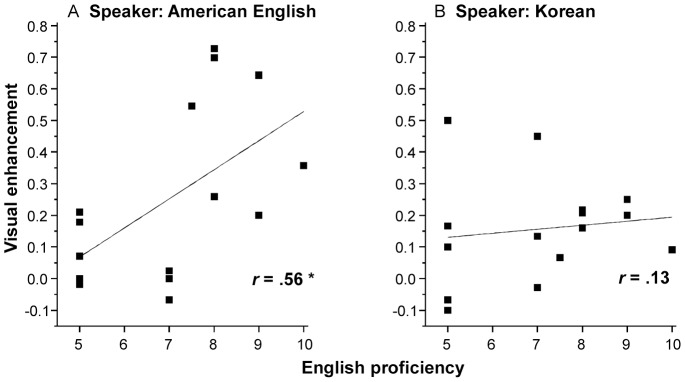
Figure 6. Visual enhancement scores as a function of self-reported English proficiency in native Korean listeners.

(A) Sentences were produced by a native American English speaker. (B) Sentences were produced by a native Korean speaker. The straight line represents the best-fitting line for the data points. r represents the correlation coefficient between visual enhancement scores and English proficiency. * denotes p<.05.
