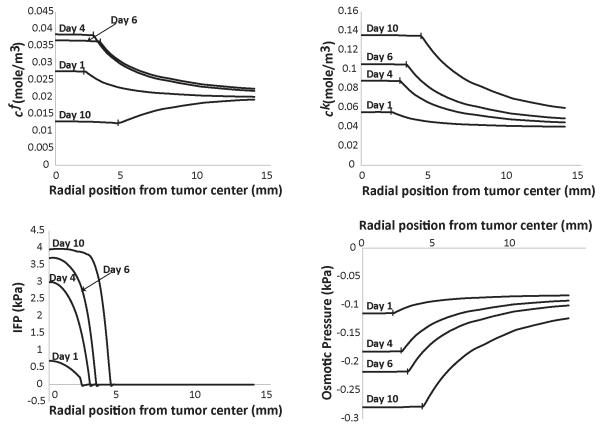
Figure 4. Spatial distribution of the concentration of fixed cf, and free, ck, ions, of the interstitial fluid pressure (IFP) and the osmotic pressure taking into account the variation of the hydraulic conductivity of the tumor during growth.
Vertical lines on the plot depict the interface of tumor and normal tissue.

