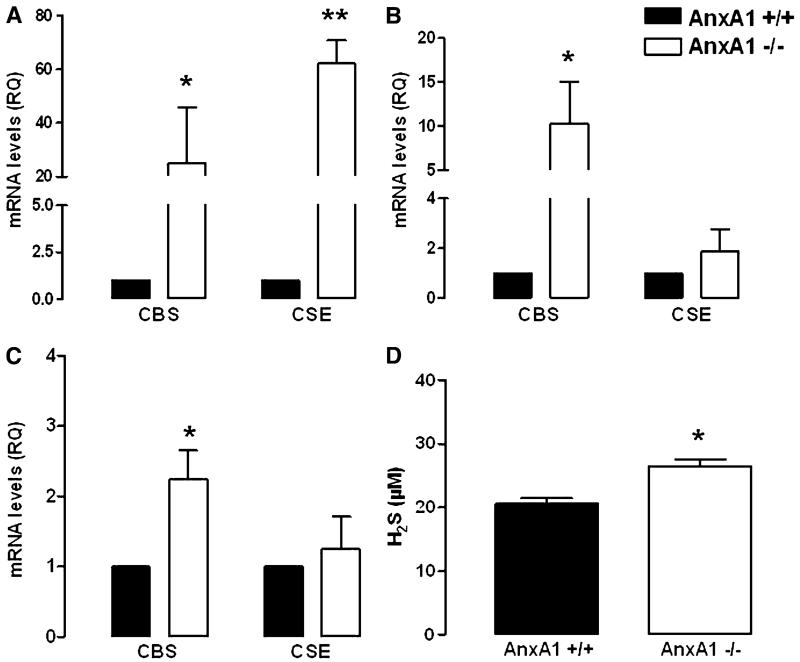
Fig. 1.
Expression of mRNA levels in different tissues harvested from AnxA1+/+ and AnxA1−/− mice. mRNA levels expressed as relative quantity (RQ) in aorta (A), spleen (B), and kidney (C), respectively. Plasma H2S levels in AnxA1+/+ and AnxA1−/− mice (D). Statistical analysis was made using Student’s t test (*P < 0.05 versus AnxA1+/+; **P < 0.01 versus AnxA1+/+; n = 6).

