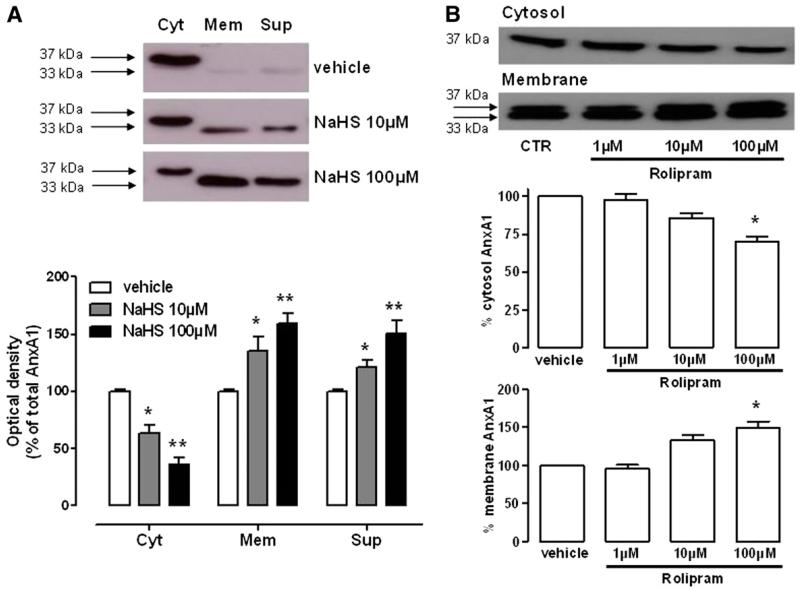
Fig. 4.
AnxA1 mobilization within human PMN and underlying mechanisms. (A) AnxA1 expression in cytosolic (Cyt), membrane (Mem), or supernatant (Sup) fractions from human PMN upon NaHS (10–100 μM, 30 minutes) challenge. Optical density is expressed as the percentage of total AnxA1. (B) AnxA1 expression in cytosolic and membrane fractions from human PMN upon treatment with PDE4 inhibitor rolipram (1–100 μM, 30 minutes). Statistical analysis was made using one-way analysis of variance (*P < 0.05, **P < 0.01 versus vehicle; n = 4).

