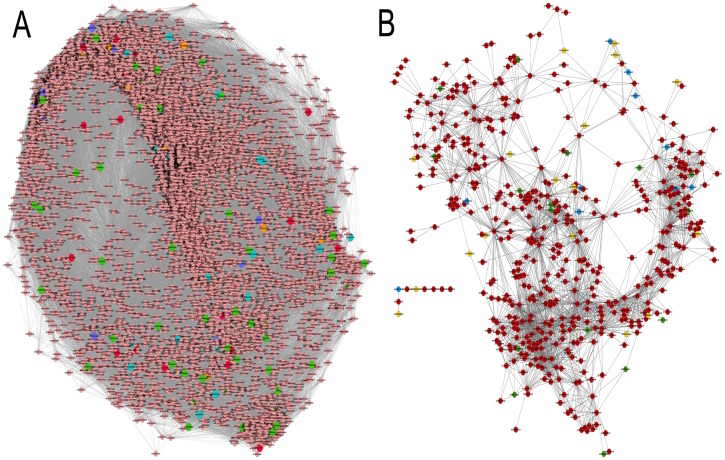
Figure 5. Gene interaction Co-expression network of Anopheles stephensi.
(a) Meta-network showing interaction between the genes. The oxidative stress genes are highlighted in different colors. (b) A sub-network representing the interaction between oxidative stress related genes. Red color nodes shows genes predicted using SVM, Green color represents the GSEA predicted genes, Dark yellow node represent GO predicted genes, Light blue shows already annotated genes.

