
Figure 6. Proteinase-3 antigen and thrombin activity in preterm BALF.
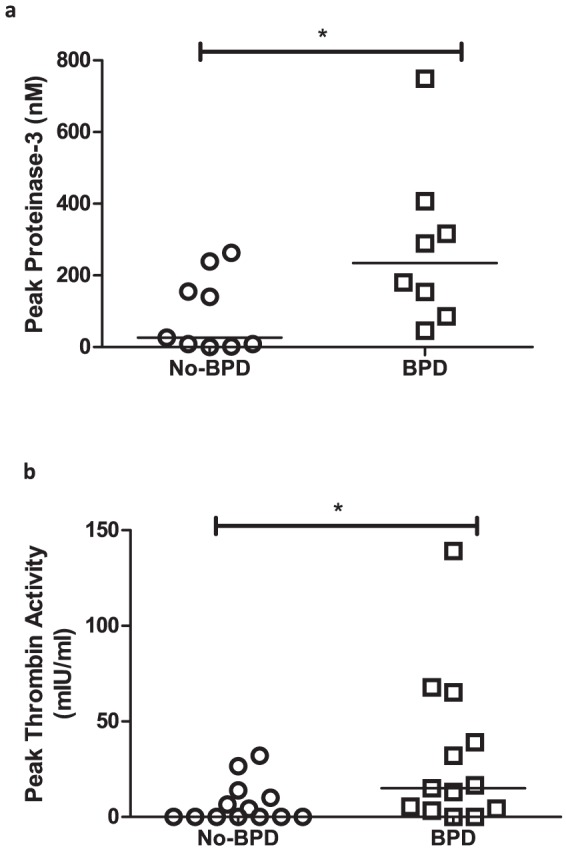
Peak (a) proteinase-3 expression (nM) and (b) thrombin activity (mIU/ml) in BALF from No-BPD (circles, n = 9 for proteinase-3 antigen and n = 13 for thrombin activity) and BPD (squares, n = 8 for proteinase-3 antigen and n = 13 for thrombin activity) infants. Groups are represented on the x-axis while concentration of each antigen (nM) or activity (mIU/ml) is represented on the y-axis. Points plotted are from individual infants and bars are at medians. (* = p<0.05)