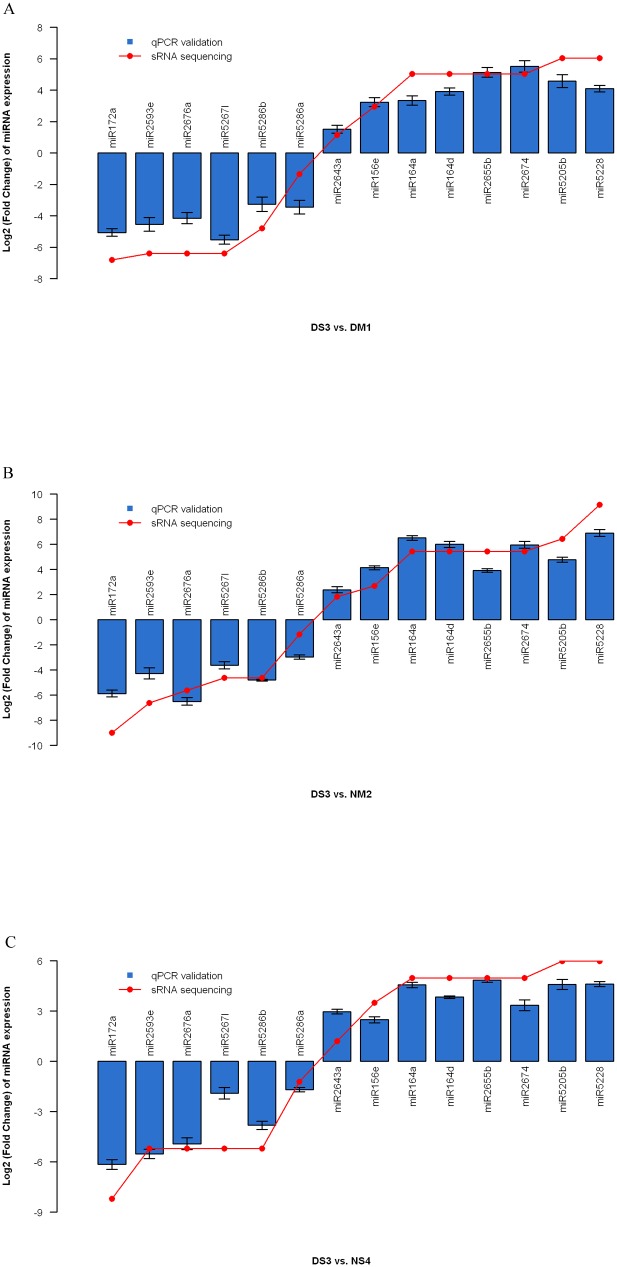
Figure 3. Sequencing and qRT-PCR.
Quantitative RT-PCR validation of differentially expressed genes in non-dormant alfalfa (NM2, and NS4) and dormant alfalfa (DM1, and DS3), including 14 genes. All data were normalized to the expression level of GAPDH. Data represent Log2 (Fold Change) of relative quantifications for DM1, NM2, and NS4 vs DS3. The error bars represent the range of the fold change as determined by the data assist software.

