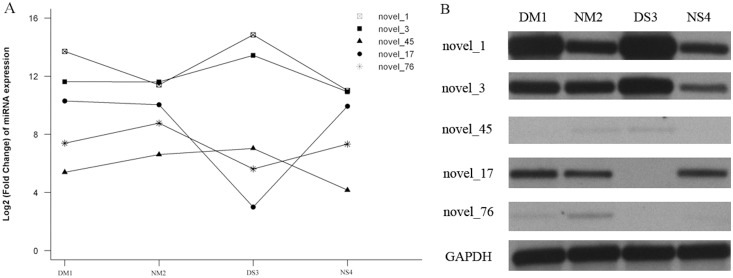
Figure 4. Northern blot analysis.

Sequencing Data represent Log2 (Fold Change) of quantification of DM1, NM2, DS3, and NS4. Northern blot analysis showed the different expressions of miR-novel_1, miR-novel_3, miR-novel_45, miR-novel_17 and miR-novel_76 in non-dormant alfalfa (NM2, and NS4) and dormant alfalfa (DM1, and DS3). GAPDH was used as a control.
