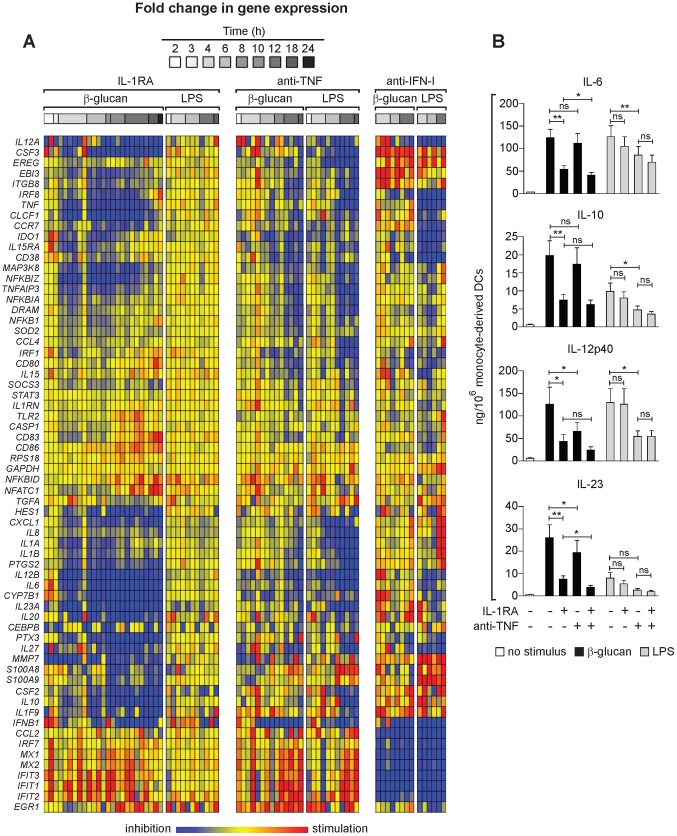
Figure 4. Regulation of the DC response to β-glucan or LPS by IL-1, TNF, and IFN-I.
(A) Human monocytes-derived DCs were stimulated with particulate β-glucan or LPS, in the presence or absence of IL-1RA (25 µg/ml) or the indicated neutralizing antibodies, for the times shown. mRNA levels in cell lysates for 64 selected genes were quantitated by NanoString's nCounter technology. The gene symbols are listed in the leftmost column of the heat map. Technical replicates were collapsed and genes hierarchically clustered (rows, genes; columns, donors). Results from individual donors were analyzed as fold change between the mRNA counts of each condition and the corresponding average levels of mRNA (baseline) across donors, times, and treatments. Final data are expressed as fold change between the mRNA counts of each condition and the corresponding baseline mRNA counts from the same cells in the absence of IL-1RA or antibodies (red, stimulation from baseline; blue, inhibition from baseline; yellow, unchanged from baseline). The heat map reports the results with all the genes analyzed by NanoString technology. The data for all the comparisons were analyzed by one-way ANOVA model using Methods of Moments [65]. The modulated genes mentioned in the text are those in which the changes induced by the perturbations were significant (p<0.05) at least at 12 h post-stimulation. (B) Human monocyte-derived DCs were cultured for 24 h as in (A). Protein secretion in the culture supernatants was measured by ELISA. Results are mean ± SEM, n = 5 to 10. Statistics: paired t-test when measurements were uncensored or the Tobit model analysis in presence of left-censored data.

