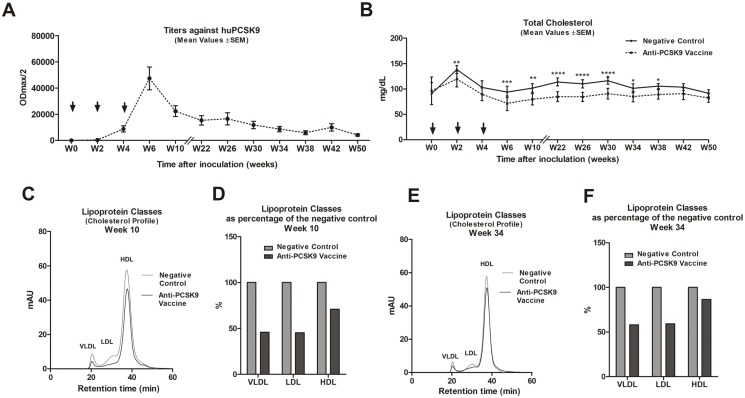
Figure 4. Long-term LDL cholesterol management upon anti-PCSK9 vaccination.
(A) Long-term evaluation over 50 weeks post prime immunization of titers against huPCSK9 (ODmax/2), generated upon 3 vaccinations in a biweekly interval (marked by arrows). Values are means ±SEM, n = 10 mice/group. (B) Measurement of TC values over the same time period as (A). Values are means; error bars represent ±SEMs. Significance values were calculated by comparison with the control group, by two-way ANOVA test, followed by Bonferroni multiple comparisons test, at the indicated time-points (n = 10 mice/group). Significance values are indicated as follows: *p<0.05; **p<0.01; ***p<0.001; ****p<0.0001. (C) FPLC lipoprotein profile of pooled plasmas within the groups (n = 10), 10 weeks post prime immunization. (D) Plasma lipoprotein levels, for three classes (VLDL, LDL, HDL), 10 weeks after prime immunization, expressed as a percentage of that for the negative control. (E) FPLC cholesterol lipoprotein profiles (VLDL, LDL and HDL) of pooled plasmas within the groups (n = 10), 34 weeks post prime immunization. (F) Plasma lipoprotein levels, for three classes (VLDL, LDL, HDL), 34 weeks after prime immunization, expressed as a percentage of that for the negative control. W: week.

