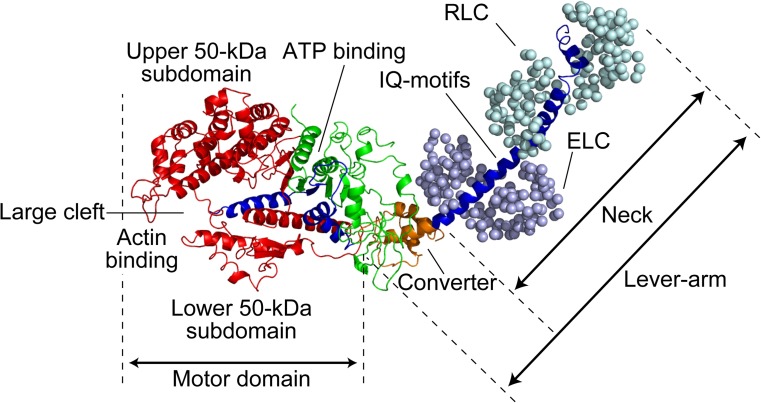
Fig. 2.
Crystal structure of skeletal myosin II S-1. The heavy chain of myosin is shown as a ribbon diagram, while two light chains [i.e. essential light chain (ELC) and regulatory light chain (RLC)] are shown as a sphere diagram. The 25-, 50-, and 20-kDa regions are colored green, red, and blue, respectively. The converter domain in the 20-kDa region is additionally colored with orange, after which IQ motifs follow

