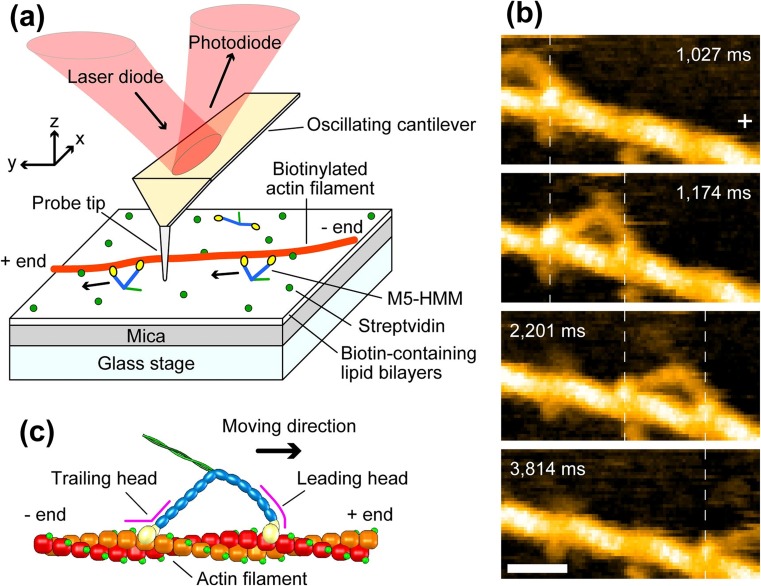
Fig. 8.
HS-AFM imaging of walking M5-HMM. a Schematic showing assay system used for the HS-AFM imaging. b Successive HS-AFM images showing unidirectional processive movement of M5-HMM observed in 1 μM ATP. Frame rate, 7 fps; Scan area, 130 × 65 nm2 with 80 × 40 pixels; scale bar 30 nm. The vertical dashed lines show the centers of mass of the motor domains, and the plus sign indicates the plus end of actin. c Schematic showing two-headed bound M5-HMM to actin. The corresponding AFM movies can be seen at the following web site: http://www.nature.com/nature/journal/v468/n7320/extref/nature09450-s2.mov

