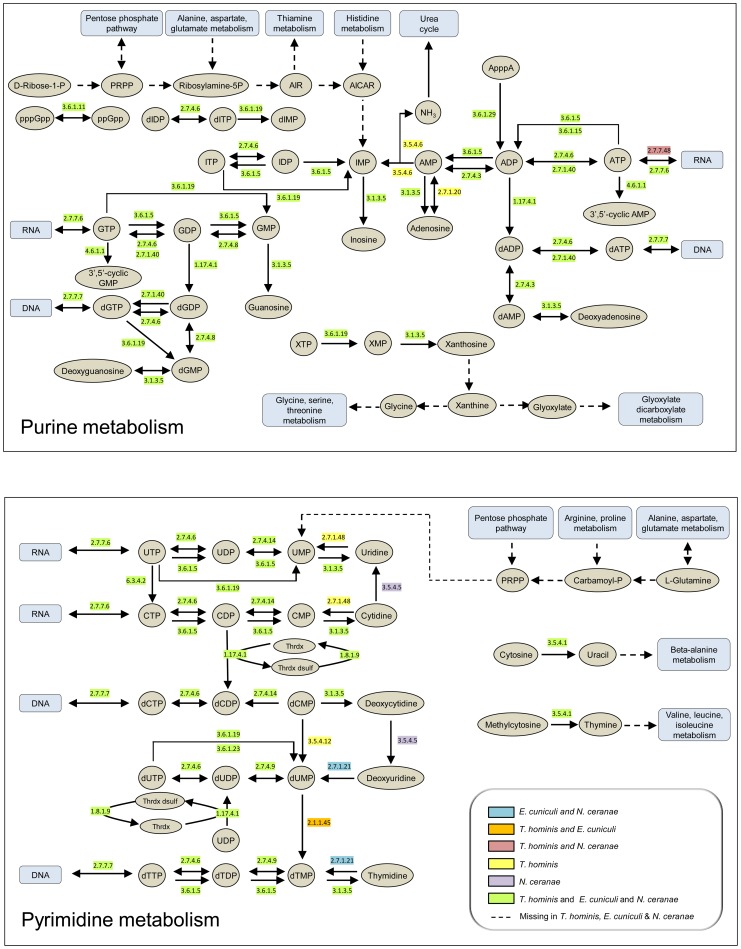
Figure 1. Purine and pyrimidine metabolism in Encepthalitozoon cuniculi, Nosema ceranae and Trachipleistophora hominis.
Enzymes predicted from analysis of published genomes [7], [10], [52] to be present in all three microsporidians are highlighted in green and those for which the genes were detected only in T. hominis in yellow. Other colours are as indicated in the key. Dashed lines with arrows indicate enzymes or pathways that appear to be entirely or partly missing in the genome sequences of all three microsporidians [7], [10], [52]. A list of enzymes and EC numbers for the microsporidians and representative intracellular bacteria is given in Table S1. The metabolic schemes for purine and pyrimidine biosynthesis were adapted from KEGG [27].

