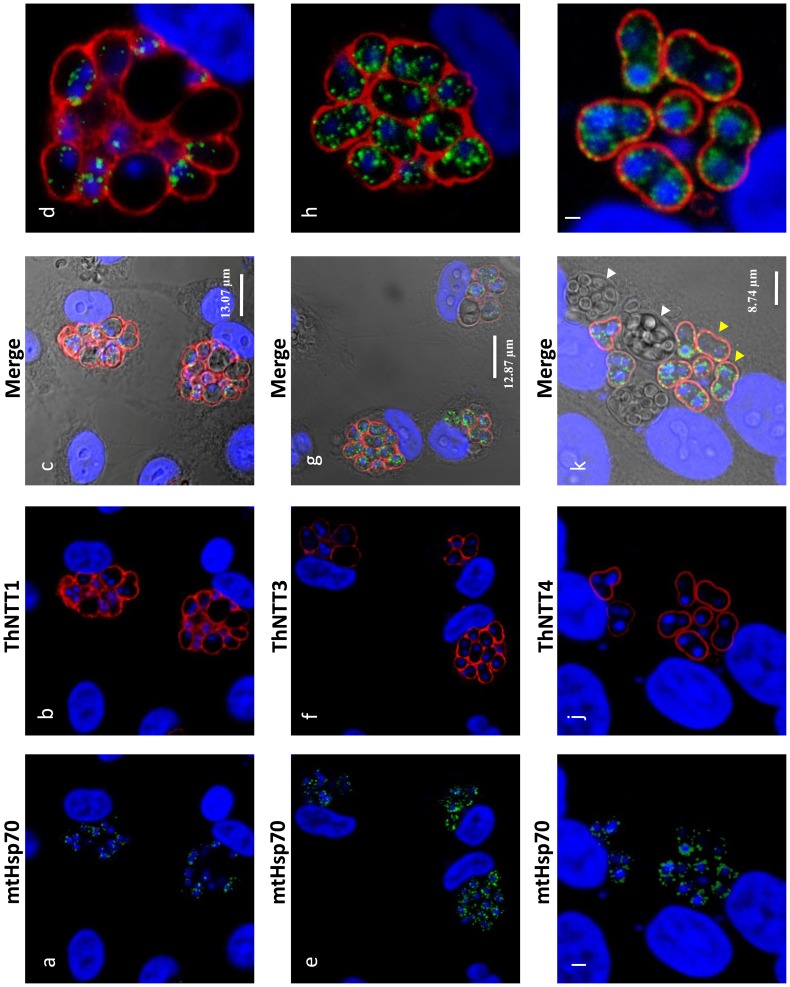
Figure 4. Plasma membrane localisation of ThNTT1, ThNTT3 and ThNTT4 demonstrated by fluorescence microscopy.
Rat antibody to the mitosomal marker Hsp70 (a, e and i) labelled discrete structures (mitosomes) inside the parasites (green) whereas rabbit antisera to ThNTT1 (b), ThNTT3 (f) and ThNTT4 (j) labelled the surface of the parasite (red). The nuclei of rabbit kidney host cells (large nuclei) and parasites (small nuclei) were labelled with DAPI (blue). c, g and k; DIC images with the three merge channels. d, h and l, enlarged images of individual clusters of T. hominis showing antibody labelling. White arrow shows aggregation of spores within the host cell. Yellow arrows show the meront or vegetative stage of the parasite.

