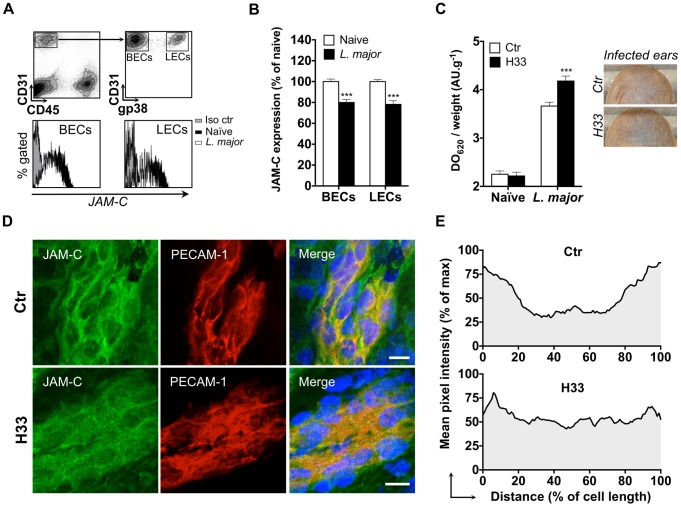
Figure 1. The antibody H33 mimics JAM-C downregulation after L. major inoculation, and locally increases vascular permeability after infection.
(A) JAM-C levels in endothelial cells populations of mouse ear. Ears were enzymatically digested and stained for FACS analysis. CD45− CD31+ gp38− cells represent blood endothelial cells (BECs), whereas CD45− CD31+ gp38+ cells are lymphatic endothelial cells (LECs). For each population, a representative histogram overlay is shown with JAM-C in endothelial cells from naïve ears (black filled), JAM-C in endothelials cells from L. major infected ears (blank filled), and the isotype control staining (grey filled). (B) The median fluorescence intensity (MFI) of JAM-C in naïve mouse ears (white bars) versus L. major infected mouse ears (black bars) was measured in BECs and LECs. The Y-axis scale represents MFI normalized to the mean MFI of naïve ears. Data represent the mean ± SEM of ten individual mice pooled from two separate experiments, and were analyzed by the unpaired Student's t test with ***: p<0.001. (C) Mice were treated with H33 or control antibody 2 hours before Evans blue was injected i.v. and L. major inoculated i.d. in the ear dermis. Skin permeability was assessed by the absorbance of Evans blue extracted from the sample normalized to the weight of ear. Results are shown for naïve versus L. major infected animals treated with H33 (black bars) or control antibody (blank bars). Representative ear pictures are shown. Data represent the mean ± SEM of seventeen mice per group pooled from two separate experiments, and were analyzed by the unpaired Student's t test with ***: p<0.001. (D) Ear sections from control antibody-treated (top panel) or H33-treated mice (bottom panel) were stained for JAM-C (green) and CD31 (red). Nucleus was stained with DAPI (blue). Scale bars, 10 µm. Control staining for JAM-C is shown in Figure S3. (E) The pixel intensity across 10 representative cells of similar size taken from three mice per group was measured and expressed as a percentage of the maximal pixel intensity. Data represent the average profile plot for the 10 cells per group analyzed.

