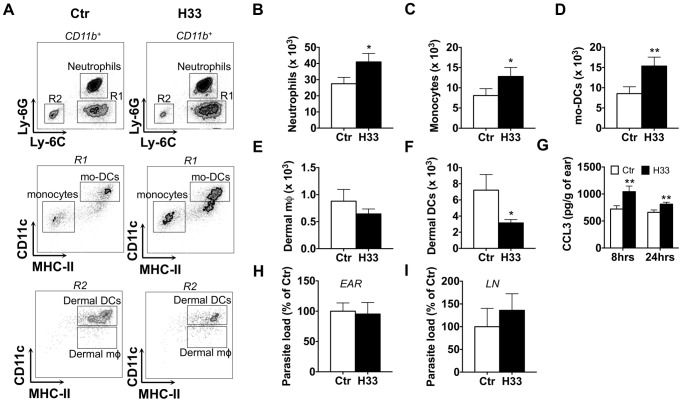
Figure 2. Blocking JAM-C increases the number of leukocytes recruited to the site of L. major infection.
(A) Representative dot plots of neutrophils (CD11b+ Ly6C+ Ly6G+); monocytes (CD11b+ Ly6C+ Ly6G− CD11c− IA−); mo-DCs (CD11b+ Ly6C+ Ly6G− CD11c+ IA+); dermal mφ (CD11b+ Ly6C− Ly6G− CD11clow IA+); dermal DCs (CD11b+ Ly6C− Ly6G− CD11chigh IA+) in control versus H33-treated animals. (B–F) The number of neutrophils (B), monocytes (C), mo-DCs (D), dermal mφ (E) and dermal DCs (F) was measured in the H33-treated (H33, black bar) versus isotype control-treated mice (Ctr, white bars) 24 hours p.i. Data represent the mean ± SEM of twenty mice per group pooled from 3 separate experiments, and were analyzed by the unpaired Student's t test with *: p<0.05 and **: p<0.01. (G) CCL3 protein levels normalized to the weight of ears were measured in H33-treated (H33, black bar) versus isotype control-treated mice (Ctr, white bars) 8 and 24 hours p.i. Data represent the mean ± SEM of ten mice per group pooled from 2 separate experiments, and were analyzed by the unpaired Student's t test with **: p<0.01. (H–I) The parasite burden in infected ears (H) and draining lymph nodes (LN) (I) were measured 48 hours p.i. by limiting dilution assay (LDA). Data are expressed as a percentage of the mean of the control group ± SEM of ten mice per group pooled from 2 separate experiments, and were analyzed by the unpaired Student's t test. For panel H and I, raw data of one representative experiment are provided in S6 Figure.

