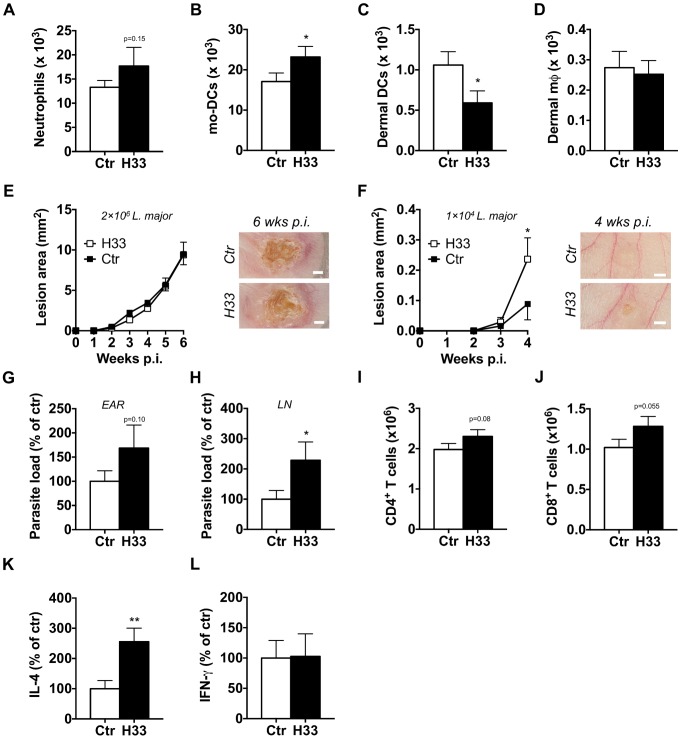
Figure 5. Blocking JAM-C boosts the Th2 cell response and worsens the disease in BALB/c mice.
The number of emigrating neutrophils (A), mo-DCs (B), dermal DCs (C) and dermal mφ (D) was measured in the ears of H33-treated (H33, black bar) versus isotype control-treated mice (Ctr, white bars) 24 hours post L. major infection. Data represent the mean ± SEM of twelve mice per group pooled from 2 separate experiments, and were analyzed by the unpaired Student's t test with *: p<0.05. (E) Mice were inoculated with 2×10⁶ stationary phase L. major promastigotes in the ear dermis and treated with H33 or control antibody for 3 weeks. The area of the lesion was monitored weekly for 6 weeks. Representative ear pictures are shown. Scale bars, 1 mm. Data represent the mean ± SEM of twenty mice per group pooled from two separate experiments. (F–L) Mice were inoculated with 1×10⁴ stationary phase L. major promastigotes in the ear dermis and treated with H33 or control antibody for 3 weeks. The area of the lesion was monitored weekly for 4 weeks. Representative ear pictures are shown. Scale bars, 0.5 mm. Data represent the mean ± SEM of ten mice per group pooled from two separate experiments. (G–H) The parasite burden in infected ears (G) and draining lymph nodes (H) were measured by LDA. Data are expressed as a percentage of the mean of the control group ± SEM of mice from panel F. (I–J) The number of CD4+ (I) and CD8+ (J) T cells were measured. Data represent the mean ± SEM of mice from panel F. (K–L) Draining lymph nodes cells were restimulated with UV-irradiated L. major for 72 hours, and the IL-4 (K) and IFN-γ (L) produced were measured. Data are expressed as a percentage of the mean of the control group ± SEM of mice from panel F. Data were analyzed by the unpaired Student's t test with *:p<0.05 and **: p<0.01. For panels expressing results as a percentage of the mean of the control, raw data of one experiment are provided in S9 Figure.

