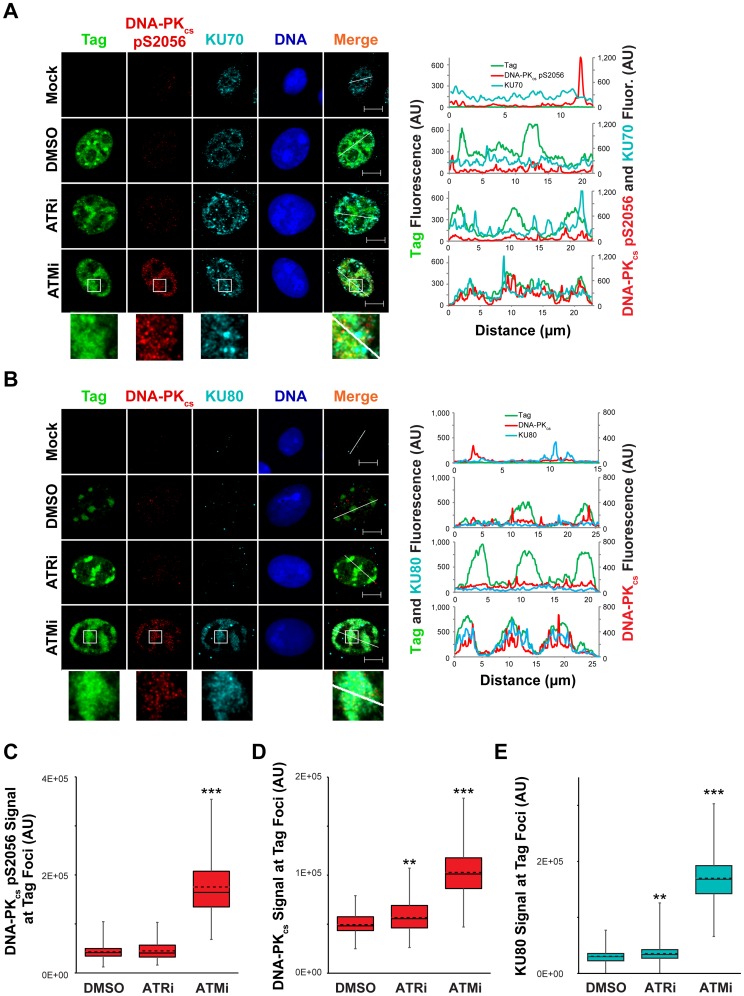
Figure 8. ATM kinase activity restricts DNA-PK localization and activation at SV40 Tag foci.
(A, B) Micrographs of chromatin-bound NHEJ factors at 48 hpi from SV40-infected BSC40 cells treated with DMSO, ATRi, or ATMi from 40–48 hpi. Scale bars represent 10 µm. Fluorescence signals along the line in the merged imaged are graphed in the right panel. (C–E) DNA-PKcs pS2056 (C), DNA-PKcs (D), or KU80 (E) fluorescence intensities at a minimum of 70 (C) or 100 (D, E) SV40 DNA replication centers from images described in (A) and (B). The average and median are shown with dashed and solid lines, respectively. The boxes encompass the 25th–75th quartiles of intensities. Minimum and maximum intensities are portrayed by the whiskers.

