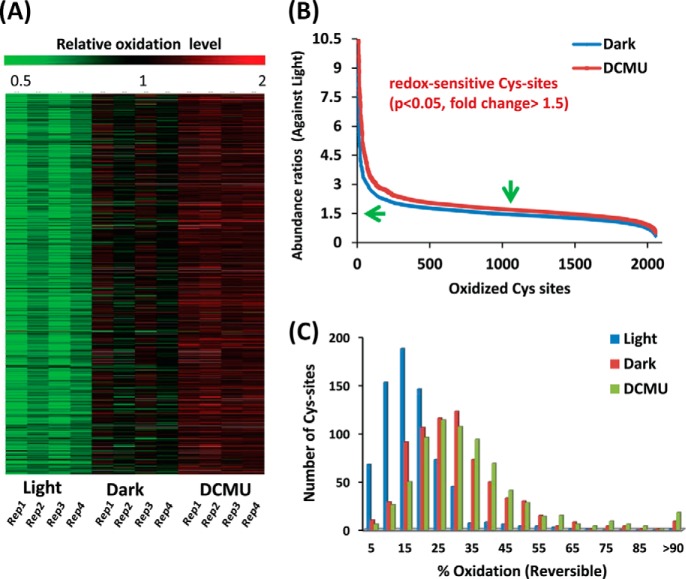
Fig. 2.
Broad Cys redox changes modulated by light/dark. A, the relative oxidation levels of ∼2,000 identified Cys sites under light, dark, or DCMU conditions. The relative oxidation levels were calculated by dividing the total reporter ion intensity from each TMT channel for a given Cys site by the average intensity across all conditions for the same Cys site. B, the redox sensitivity of individual Cys sites. The y-axis abundance ratios are expressed as the ratios of oxidation levels under dark or DCMU conditions divided by those under the light condition. Peptides were considered confidently redox-sensitive if all four data points were observed (p < 0.05 and fold change > 1.5-fold). C, distribution of Cys sites in terms of the percentage of Cys oxidation for individual Cys residues. Histograms show a shift to higher levels of oxidation for dark and DCMU relative to light.

