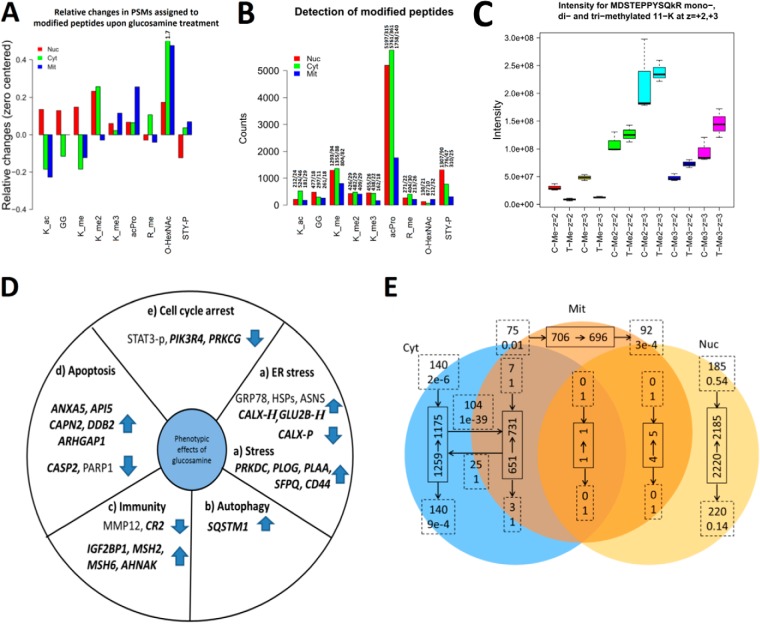
Fig. 5.
Effect of GlcN treatments on detected posttranslational modifications. In A, B, and C, _ac corresponds to acetylation; GG, diglycine from ubiquitin; P, phosphorylation; _me, mono-, me2 di-, and me3 is tri- methylation. z is charge state. A, Relative changes in modifications observed after GlcN treatment for the nuclear, cytosolic and mitochondrial fractions based on spectral counting. Relative changes of O-HexNAc for cytosolic fraction went out of scale indicated by the number 1.7. B, Number of PSMs for modified peptides in the nuclear, cytosolic, and mitochondrial fractions. Bar labels indicate: “number of PSMs for modified peptides/number of unique spectra assignments for modified peptides.” C, GlcN increased the levels of EF1A1 methylation in the nuclear fraction. Intensity counts from survey scans for the mono-, di-, and tri- methylated peptide MDSTEPPYSQkR (on 11-K) from elongation factor “EF1A1.” D, Summary of the most relevant markers for (a) ER stress, (b) autophagy, (c) immunity, (d) apoptosis, and (e) cell cycle arrest that were significantly regulated at the protein level after the GlcN treatment. Novel findings are highlighted in bold and italics. “H” indicates O-HexNAcylation, and “P” indicates phosphorylation. E, Protein overlap between subcellular fractions using a 1% FDR threshold and a minimum of five PSMs assigned per protein in a specific subcellular fraction. Full line boxes indicate the number of proteins before (start of arrow) and after (end of arrow) the GlcN treatment. Dashed line boxes indicate the exchange of proteins after the GlcN treatment (upper text is the number of proteins and lower text is the likelihood such an exchange of proteins occurred by chance). Dashed line boxes located at the start of an arrow are the number of new proteins observed only after GlcN treatment and those located at the end of an arrow are the number of proteins only observed before GlcN treatment.

