Fig. 4.

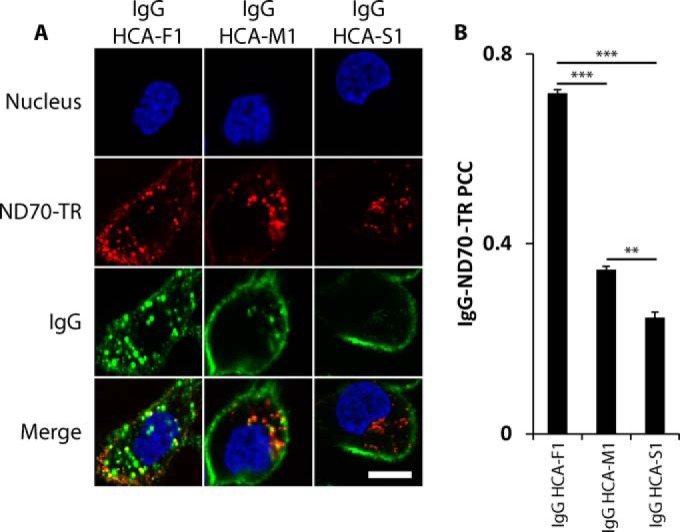
Internalization and colocalization analysis of IgGs derived from scFvs. A, DU145 cells co-incubated with three IgGs with different internalization properties at 10 μg/ml and 50 μg/ml ND70-TR (red) for 90 min at 37 °C. Cells were immunolabeled against IgG using anti-human Fc (green). Nuclei were stained with Hoechst 33342 (blue). Single confocal Z-slice images are shown. Scale bar: 20 μm. B, PCC analysis of colocalization of IgGs HCA-F1, HCA-M1, and HCA-S1 with ND70-TR using Z-slices crossing the entire cell, quantitating a minimum of 10 cells. ** and *** denote two-tailed t test p values of <0.01 and <0.001, respectively. Error bars represent S.E. for n = 3.
