
Fig. 3.
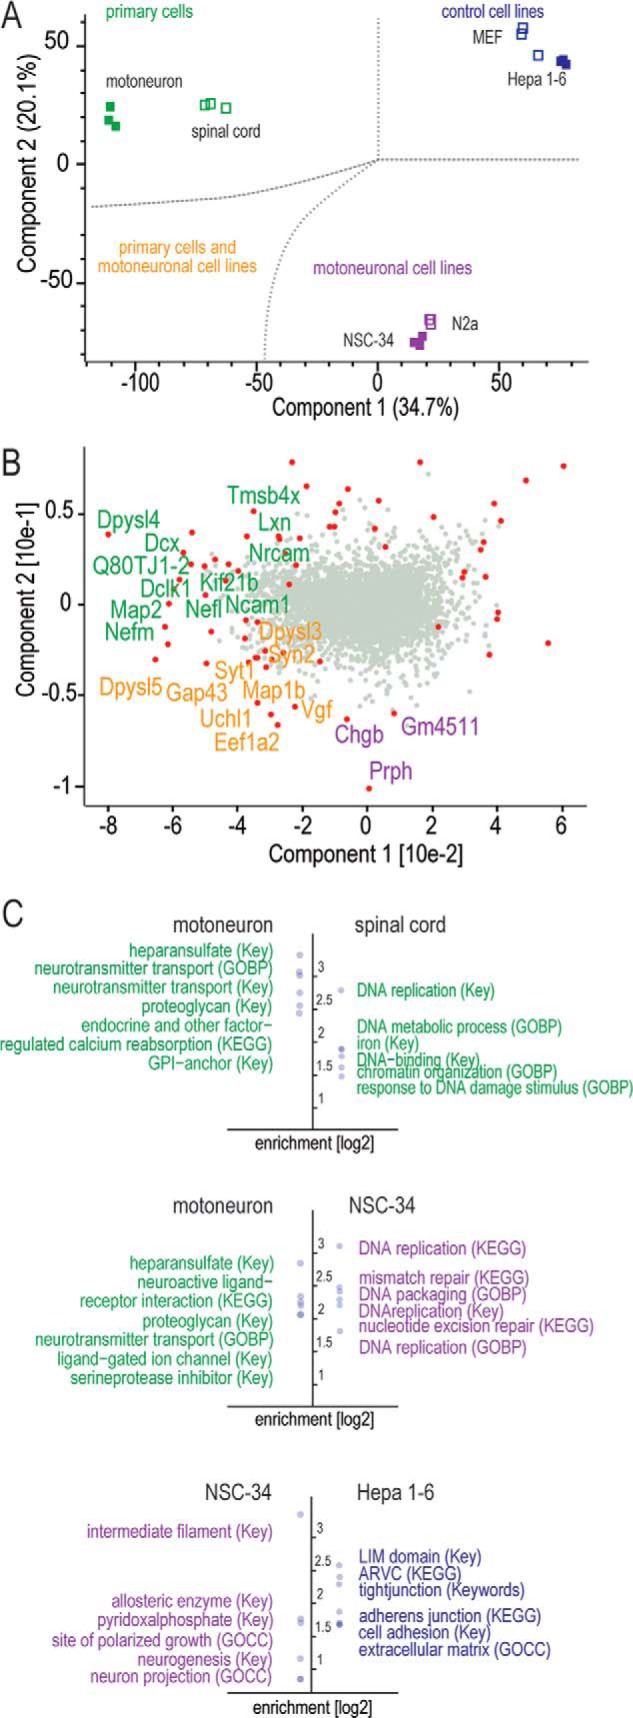
Global proteomic comparison of motoneuron-like cell lines, embryonic spinal cord, unrelated cell lines, and primary motoneurons. A, PCA of protein expression values of the different systems. Component 1 and component 2 account for 54.8% of the data variation. B, significant outliers from analysis of variance (FDR cutoff = 1%, S0 fold-change cutoff = 4) are depicted in red in the PCA loading distribution (gray dots). Proteins driving the separation are colored according to the PCA plot in A. C, analyses of enriched annotation (Fisher's exact test) for t test significant (FDR cutoff = 2%, S0 fold-change cutoff = 4) outlier populations. The six most enriched (log 2) annotations from UniProt Keywords (Key), GO biological process (GOBP), GO cellular compartment (GOCC), and KEGG are depicted.