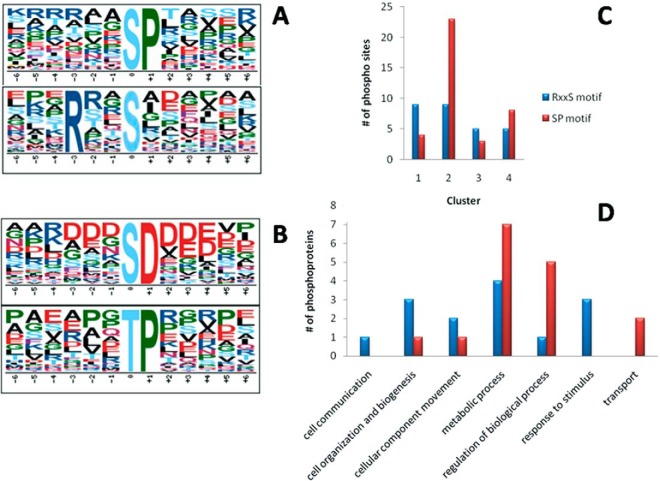
Fig. 5.
Consensus motif enrichment analysis. Overrepresented phosphorylation motifs among regulated phosphorylation sites relative to total T. cruzi database (A). Overrepresented phosphorylation motifs among all detected phosphorylation sites relative to total T. cruzi database (A and B). Cluster-wise distribution of regulated motifs (C). GO biological process categorization of annotated phosphoproteins containing regulated phosphorylation events within enriched motifs (D).

