Fig. 4.
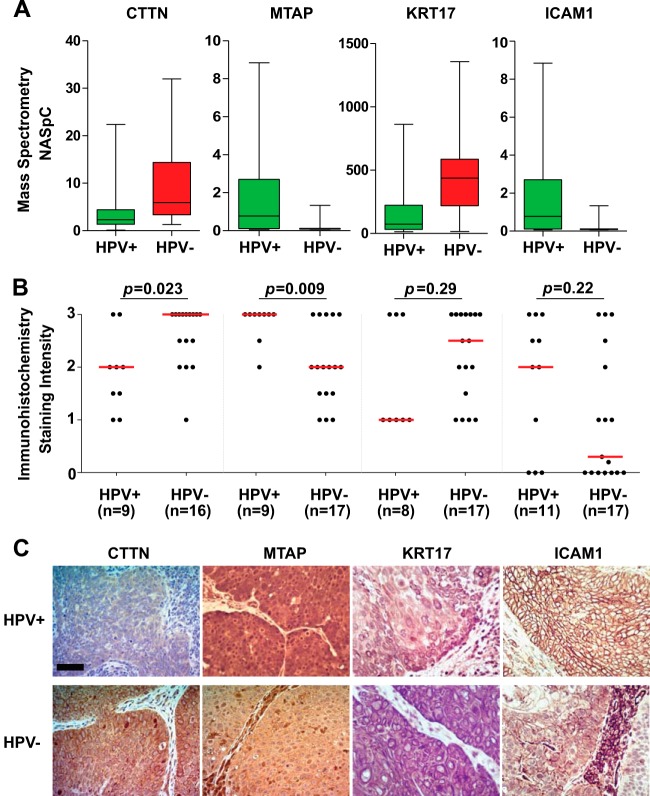
Verification of selected differentially expressed proteins by IHC on pre-treatment OPC biopsies. A, relative abundances of selected proteins in the discovery cohort. B, IHC staining intensities in HPV+ and HPV− OPCs. The Wilcoxon rank-sum test was used to compare median immunoexpression levels (red lines). For a few specimens, IHC staining could not be evaluated because of the absence of tumor cells in the given tissue section; this explains the variations in the number of samples. C, representative IHC images. Scale bar, 50 μm.

