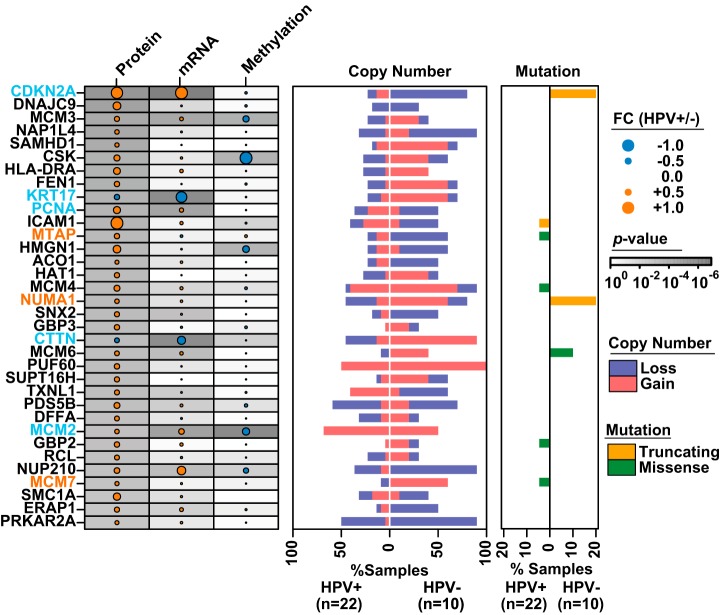
Fig. 6.
Integrated -omics analysis of OPC via integration with TCGA data. The top differentially abundant proteins among HPV± OPCs and the corresponding mRNA expression, methylation, copy number, and mutational changes in the OPC subset of the TCGA HNC study. FC values were normalized to the maximum across features for visualization. Light blue font denotes examples of genes with concordance across multiple -omic profiles; orange font denotes examples of genes for which relative protein abundance would have been difficult to predict based on genomic profiles alone.

