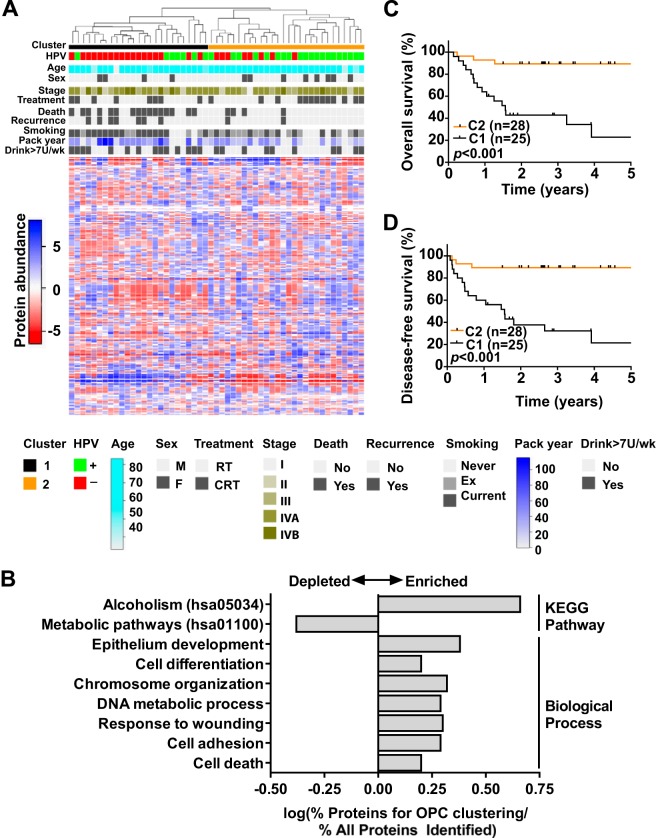
Fig. 7.
Proteomic subtypes of OPC. A, unsupervised hierarchical clustering of 53 OPCs based on globally normalized adjusted spectral counts of the top 10% of proteins (n = 263) with the highest variance. B, significantly enriched (FDR < 0.05) KEGG Pathway and GO Biological Process terms for proteins used for cluster analysis. Select categories are shown. C, five-year overall survival in OPC patients according to proteomic clusters. D, five-year disease-free survival in OPC patients according to proteomic clusters. Comparison of the survival rates between patient groups was based on the log-rank test.

