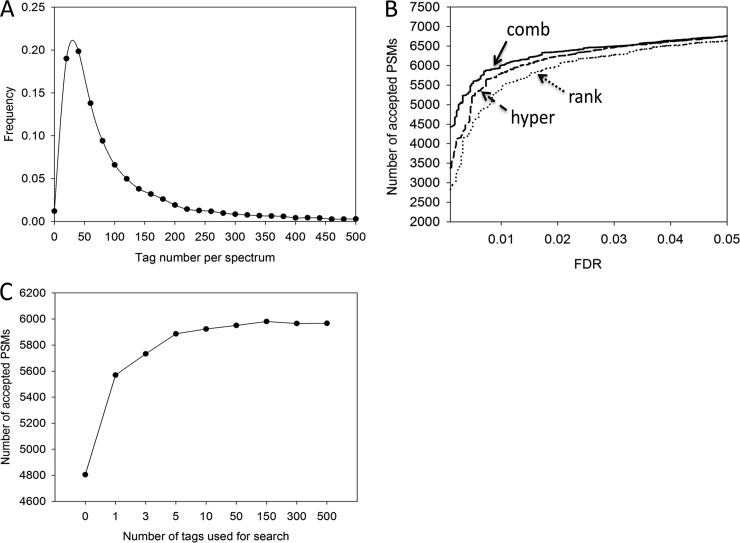
Fig. 3.
Tag derived by JUMP. A, distribution of the tag number for individual MS/MS spectra in the first dataset. B, pseudo–receiver operating characteristic curves for the comparison of three tag scoring methods: the Wilcoxon rank sum test (“rank”), the hypergeometric test (“hyper”), and the combined method (“comb”). C, the number of expected true PSMs influenced by the number of top tags selected for the database search.

