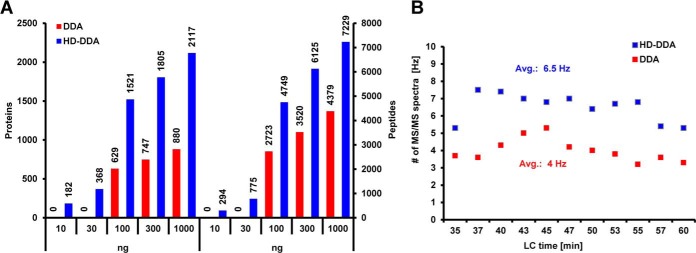
Fig. 2.

Performance comparison regarding sensitivity of the HD-DDA and DDA methods. A, Dilution series of a HeLa digest from 1.000 ng to 10 ng on column (each analyzed on a 60-min LC-gradient) via DDA (red) and HD-DDA (blue), illustrating the differences of both methods for peptide and protein identification. B, Comparison of the rate of tandem mass spectrum acquisition (in Hz) across the LC-gradient for DDA (red) and HD-DDA (blue).
