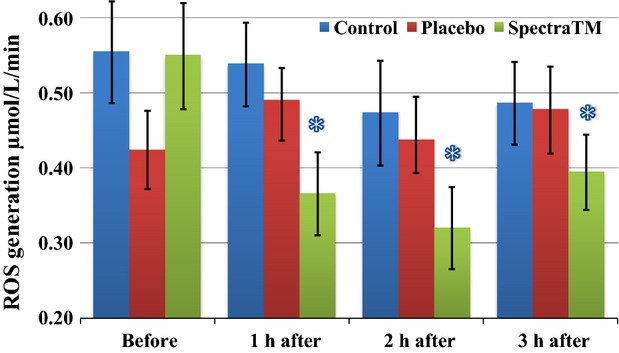
Figure 4.

Effect of SPECTRA™ on “mitochondrial” ROS generation in blood cells collected from human volunteers. Detection of mitochondrial ROS generation was performed using spin probe CMH (200 μmol/L) and bench-top EPR spectrometer nOxyscan after addition of Antimycin A (10 μmol/L) in the blood samples taken prior to and at 60, 120, 180 min after consumption of standard breakfast (bread roll with glass of water). Blue columns (control): prior to and 60, 120, 180 min after consumption of standard breakfast (bread roll with glass of water); red columns (placebo): after consumption of standard breakfast and placebo capsule; and green columns (SPECTRA™): after consumption of standard breakfast and SPECTRA™ capsule. The values of ROS generation were calculated as delta value between “total” and “Antimycin A” sample. Data are mean ± SEM (n = 22), *P < 0.05 versus value “before.” CMH, 1-hydroxy-3-methoxycarbonyl-2.2.5.5-tetramethylpyrrolidine; EPR, elec-tron paramagnetic resonance; ROS, reactive oxygen species.
