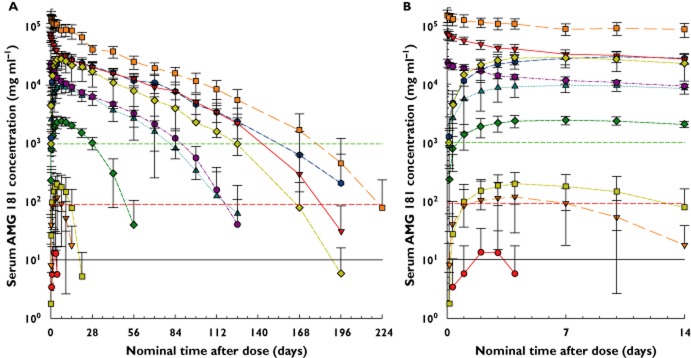
Figure 2.

Mean (SD) serum AMG 181 concentration–time profiles after single subcutaneous or intravenous dose in healthy or ulcerative colitis subjects (UC). The full PK profile (A) and the absorption phase only (B) are shown. s.c. = subcutaneous; i.v. = intravenous; LLOQ = lower limit of quantification; RO = α4β7 receptor occupancy on CD4+ naïve T cells. LLOQ and EC50 = 0.01 μg ml−1 (—), EC90 = 0.09 μg ml−1 (– –), and EC99 = 0.99 μg ml−1 (- - -).  , Cohort 1: 0.7 mg s.c. (n = 3–4);
  , Cohort 2: 2.1 mg s.c. (n = 4);
  , Cohort 3: 7 mg s.c. (n = 5–6);
  , Cohort 4: 21 mg s.c. (n = 5–6);
  , Cohort 5: 70 mg s.c. (n = 5–6);
  , Cohort 6: 210 mg s.c. (n = 5–6);
  , Cohort 7: 70 mg i.v. (n = 5–6);
  , Cohort 8: 210 mg i.v. (n = 4–6);
  , Cohort 9: 420 mg i.v. (n = 4–6);
  , Cohort 10: 210 mg s.c.UC (n = 3).
