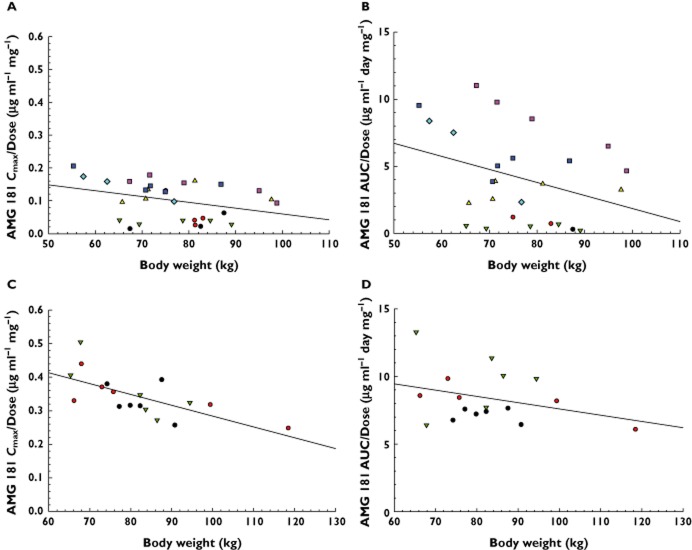
Figure 3.
Body weight effects on dose-normalized AMG 181 Cmax (Cmax/Dose) and AUC(0,∞) (AUC(0,∞)/Dose) for subcutaneous (A and B) or intravenous (C and D) administration. Symbols are observations and lines represent linear regressions. s.c. = subcutaneous; i.v. = intravenous. (A and B) •, Cohort 1: 0.7 mg s.c. (n = 1–3);  , Cohort 2: 2.1 mg s.c. (n = 2–4);
  , Cohort 3: 7 mg s.c. (n = 5);
  , Cohort 4: 21 mg s.c. (n = 5);
  , Cohort 5: 70 mg s.c. (n = 5);
  , Cohort 6: 210 mg s.c. (n = 5);
  , Cohort UC (10): 210 mg s.c. (n = 3); —, linear regression line. (C and D) •, Cohort 7: 70 mg i.v. (n = 6);
  Cohort 8: 210 mg i.v. (n = 5–6);
  , Cohort 9: 420 mg i.v. (n = 5–6); —, linear regression line.

