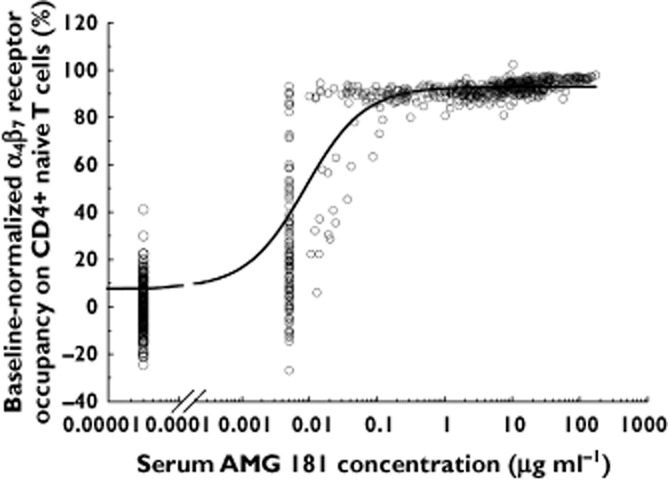
Figure 5.

Individual healthy subject pre-dose baseline-normalized α4β7 receptor occupancy on CD4+ naïve T cell vs. serum AMG 181 concentrations. All data from pre-dose and placebo treated subjects are plotted at AMG 181 = 0 μg ml−1. The line represents the Emax pharmacodynamic model fit of the observed data. RO data with AMG 181 concentrations measured to be < 0.01 μg ml−1 (assay LLOQ) were plotted against 0.005 μg ml−1, corresponding to LLOQ/2. These data were not used for PD modelling because the exact AMG 181 concentrations for these samples could not be quantified
