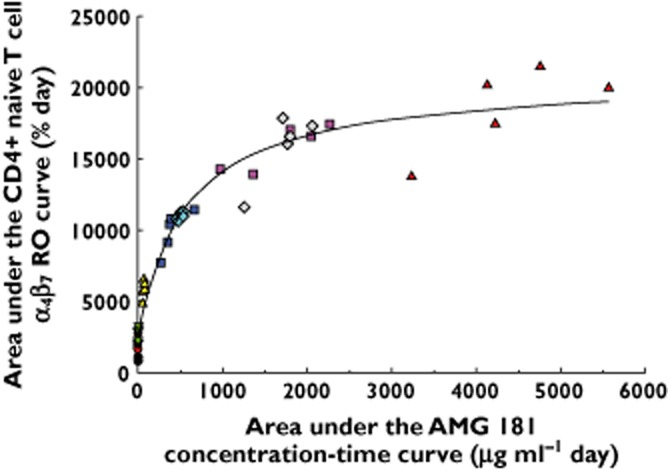
Figure 6.

Individual healthy subject area under the effect−time curve for pre-dose baseline-normalized α4β7 receptor occupancy (RO) on CD4+ naïve T cells (AUECall) vs. serum AMG 181 area under the concentration−time curve (AUCall) profile (symbols) and the Emax PD model fitting of the observed data (line). s.c. = subcutaneous; i.v. = intravenous. •, Cohort 1: 0.7 mg s.c. (n = 3);  , Cohort 2: 2.1 mg s.c. (n = 4);
  , Cohort 3: 7 mg s.c. (n = 5);
  , Cohort 4: 21 mg s.c. (n = 5);
  , Cohort 5: 70 mg s.c. (n = 5);
  , Cohort 6: 210 mg s.c. (n = 5);
  , Cohort 7: 70 mg i.v. (n = 6);
  , Cohort 8: 210 mg i.v. (n = 5);
  , Cohort 9: 420 mg i.v. (n = 5)
