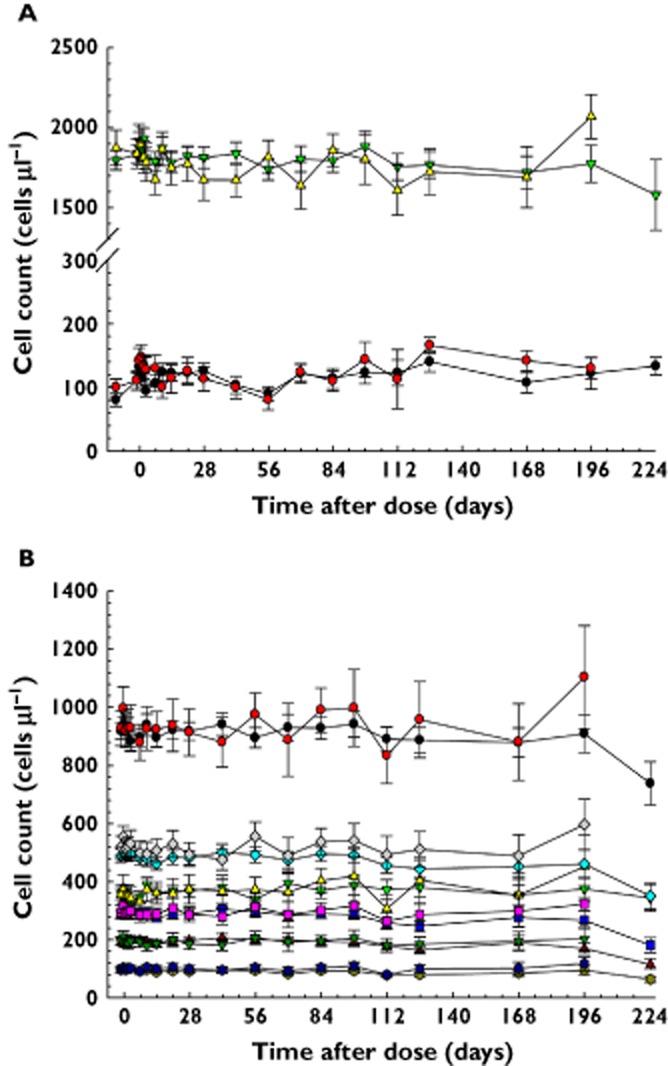
Figure 7.

Mean count (SEM) profiles of lymphocytes and eosinophils (A) and CD4+ total, naïve, central memory (Tcm), and memory (mem) T cells, and Tcm cells expressing low or high levels of α4β7 receptors (B) in all subjects treated with AMG 181 or placebo. (A)  , Eosinophil, active;
  , Eosinophil, placebo;
  , Lymphocyte, active;
  , Lymphocyte, placebo; Active (n = 5–50); Placebo (n = 6–19). (B)
  , CD4 + total, active;
  , CD4 + total, placebo;
  , CD4 + naive, active;
  , CD4 + naive, placebo;
  , CD4 + Tcm, active;
  , CD4 + Tcm, placebo;
  , CD4 + mem, active;
  , CD4 + mem, placebo;
  , α4β7 low CD4 + Tcm, active;
  , α4β7 low CD4 + Tcm, placebo;
  , α4β7 high CD4 + Tcm, active;
  , α4β7 high CD4 + Tcm, placebo; Active (n = 5–52); Placebo (n = 5–18)
