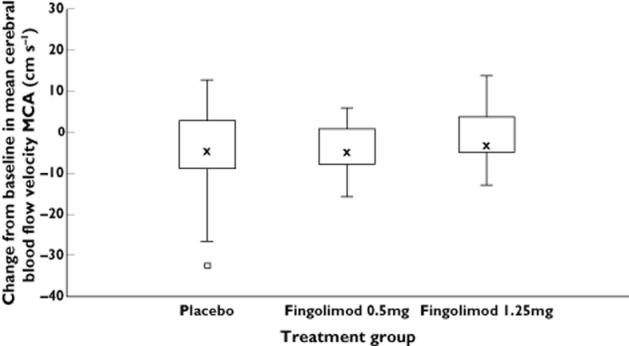
Figure 2.

Change from baseline in mean cerebral blood flow velocity: Middle cerebral artery at day 28. The median for each treatment is represented by cross, the upper (lower) edge of the box represents the 75th (25th) percentile. A whisker is drawn from the upper (lower) edge of the box to the largest (smallest) value within 1.5 × interquartile range above (below) the edge of the box, values outside the whiskers are identified with a square. MCA middle cerebral artery
