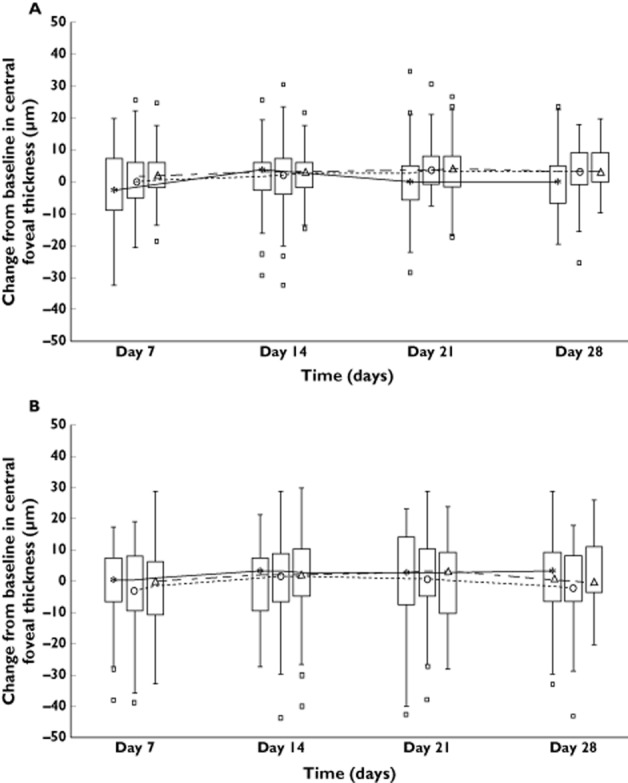
Figure 4.

Change from baseline in central foveal thickness in (A) the left eye and in (B) the right eye. The median of each time point is joined by a line. The upper (lower) edge of the box represents the 75th (25th) percentile; a whisker is drawn from the upper (lower) edge of the box to the largest (smallest) value within 1.5 x interquartile range above (below) the edge of the box; values outside the whiskers are identified with a square.  , placebo;
  , fingolimod 0.5 mg;
  , fingolimod 1.25 mg
