Figure 2.

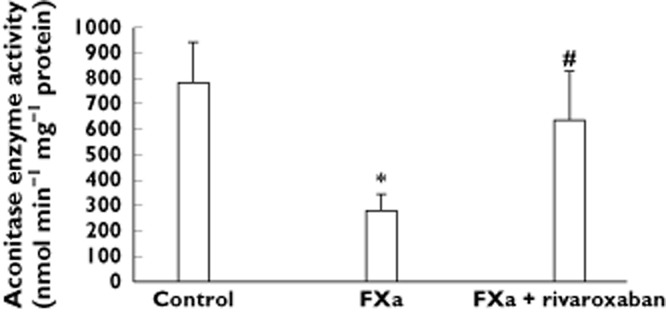
Bar graphs show aconitase activity in diabetic femoral arteries incubated in presence and absence of FXa and rivaroxaban. Results are represented as mean ± SEM. *P < 0.05 with respect to control. #P < 0.05 with respect to FXa alone

Bar graphs show aconitase activity in diabetic femoral arteries incubated in presence and absence of FXa and rivaroxaban. Results are represented as mean ± SEM. *P < 0.05 with respect to control. #P < 0.05 with respect to FXa alone