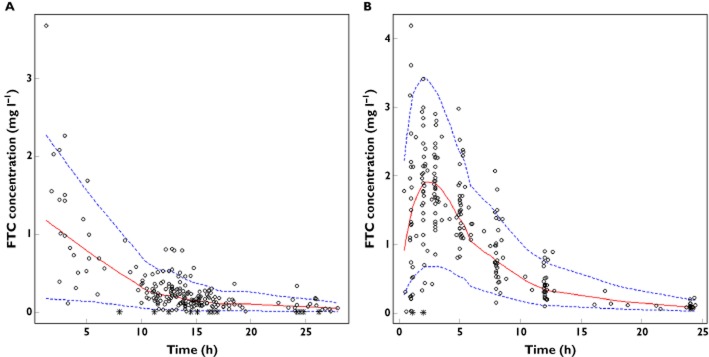
Figure 1.

Validation of the final model by the visual predictive check (VPC) stratified by dose. Comparison between the 5th (dashed line), 50th (solid line) and 95th (dashed line) percentiles obtained from 1000 simulations and the observed data (circles) for FTC concentrations in (A) therapeutic drug monitoring study (200 mg dose) and (B) TEmAA ANRS 12109 study (400 mg dose). Asterisks denote data below the limit of quantification (LOQ)
