
Figure 3.
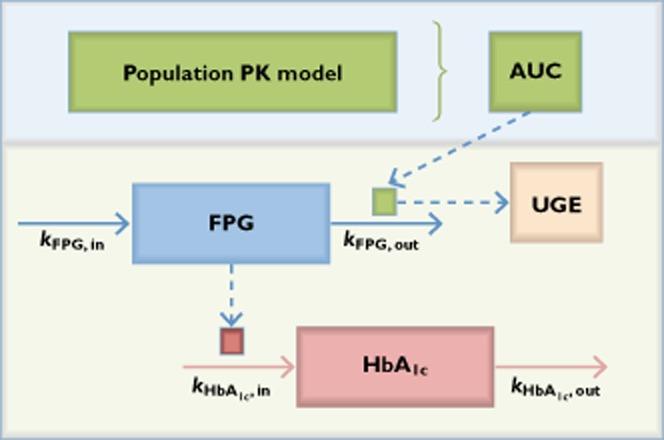
Schematic of population pharmacokinetic and exposure−response model.  , stimulation (STIM) lowered FPG and increased UGE;
  , decreased FPG decreased HbA1c production
Official websites use .gov
A
.gov website belongs to an official
government organization in the United States.
Secure .gov websites use HTTPS
A lock (
) or https:// means you've safely
connected to the .gov website. Share sensitive
information only on official, secure websites.
Schematic of population pharmacokinetic and exposure−response model. , stimulation (STIM) lowered FPG and increased UGE; , decreased FPG decreased HbA1c production